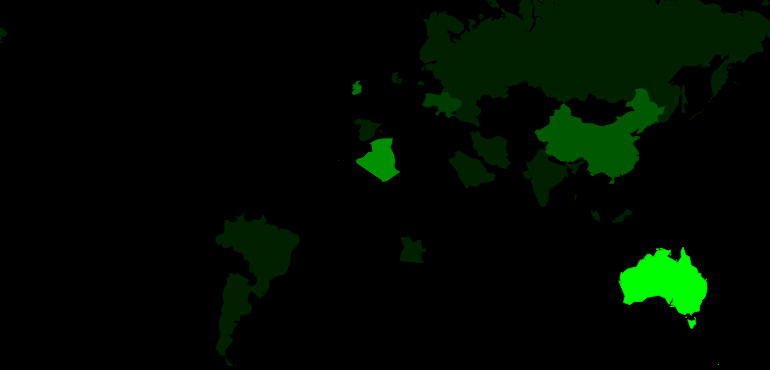
I wanted to have some maps in my World of Films and Cocktails series. Like this:
 I tried various mapping services, but nothing was flexible enought to do what I wanted. I wanted more recently “visited” countries to be brighter, I wanted it to be scriptable, I wanted it to be easy to take unassisted “screenshots”, and I wanted an interactive version where you could click on the countries to get some information.
Then I found Google GeoChart. It’s really kinda geared towards displaying numerical data per country, but it’s flexible enough that you can disable almost all of the distracting, ugly elements. And, as a bonus, it generates SVG images, so whatever you can’t disable with the features provided, you can just alter by inspecting the DOM after the image has been generated.
Kudos to Google. It’s very neat. I managed to make the maps look exactly like I had envisioned.
You can see the interactive version here, and the source code is on github. It’s totally trivial. It just sets a bunch of defaults, and then (after inspecting the DOM a bit), it removes some textures. And adds events that pop up lightboxes that point back to the films.
To create the snapshots of the charts, I use PhantomJS. It allows rendering web pages headless, and generates a PNG as the result. It’s really neat and easy to work with. With all this in the tool chain, I can generate the WFC entries automatically without human intervention.
Well. Somebody has to make the cocktails. And drink them. And edit out the boring screenshots.
Yes! I do that! The nerve of some people…