I thought I could use my prodigious financial know-how to do an analysis of Emacs Open Bugs chart.
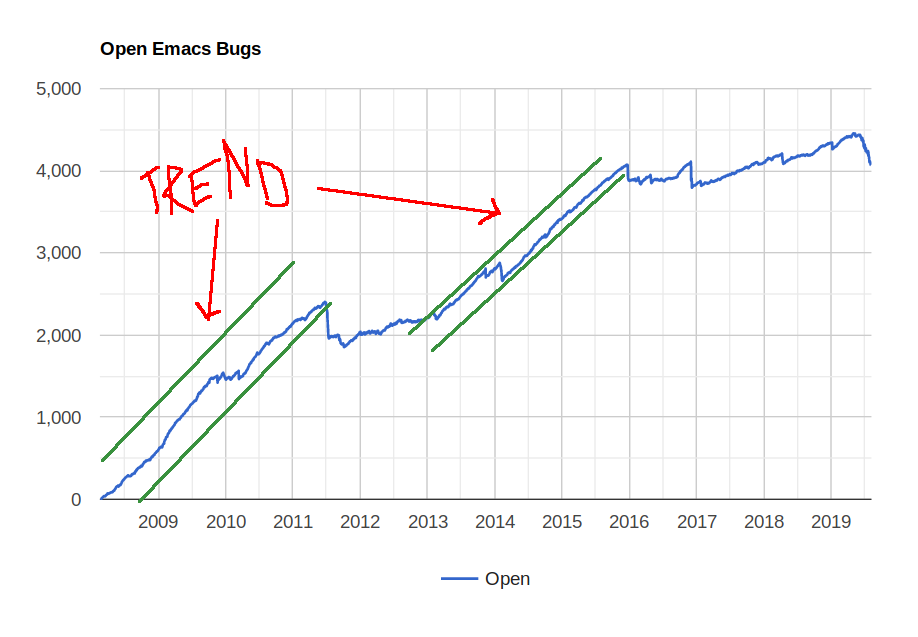
First of all, we have clearly defined positive trend channels reaching back to 2009, broken by a period of recession.
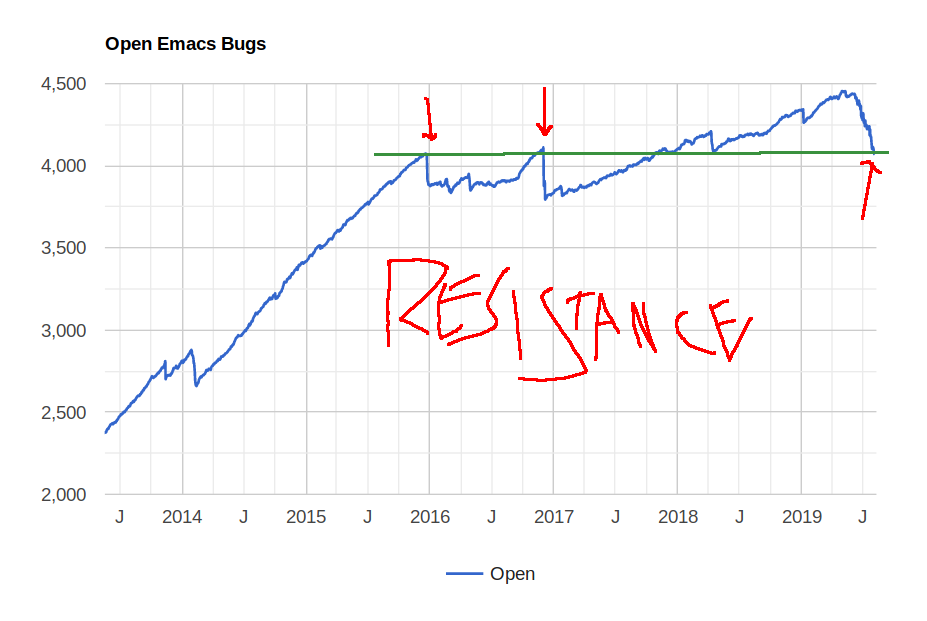
But lately, this growth has been curbed and we’ve seen a clear development of a resistance line at 4100. It looked like we’d broken out of it in 2018, but then we have a reversal, but judging on this clear resistance, we’ll soon see a bounce-back.
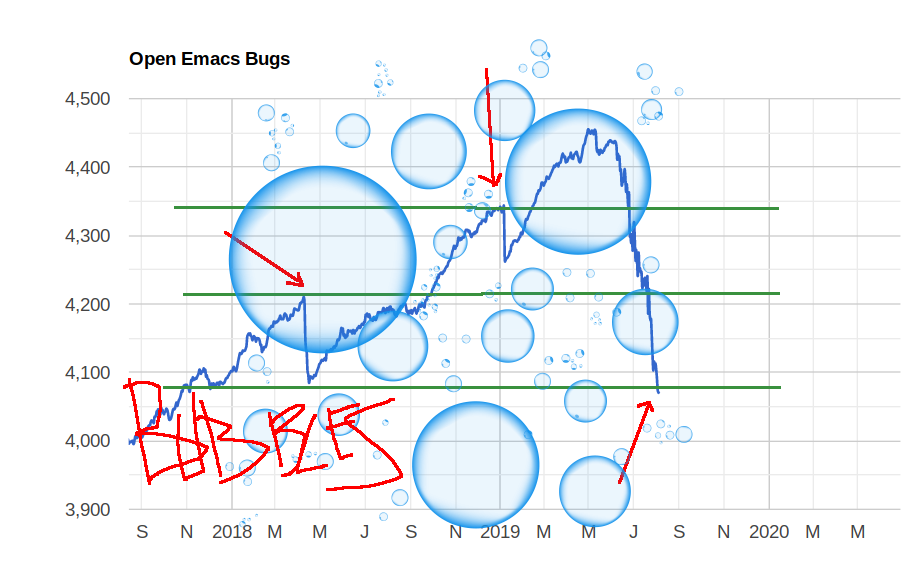
Zooming even closer into the last couple of years, we see the emergence of a linear Fibonacci reversal trend coupled with a reverse Head & Shoulders® pattern complete with magnificent bubbles appearing and not the least hint of dandruff sloughing off of the chart, complete with a 10% (450 bugs) reduction due to me procrastinating a lot over the past month and a half and going through old bug reports, but now there’s a two week vacation from the vacation coming up.
This can only mean one thing, and I don’t have to spell it out for you, I think: Sell, sell, S-E-L SELL!
One thought on “Technical Analysis”