I’ve been plugging away at the Emacs bug database the last month or so. I’m the kind of person who gets obsessed with something for a time and then I do something completely different the next month. So I’m away from Emacs developments for months on end (and this time it’s basically been a couple of years Due To Circumstances), but when I’m back and hacking away, I’m always wondering:
Are things getting better or are things getting worse?
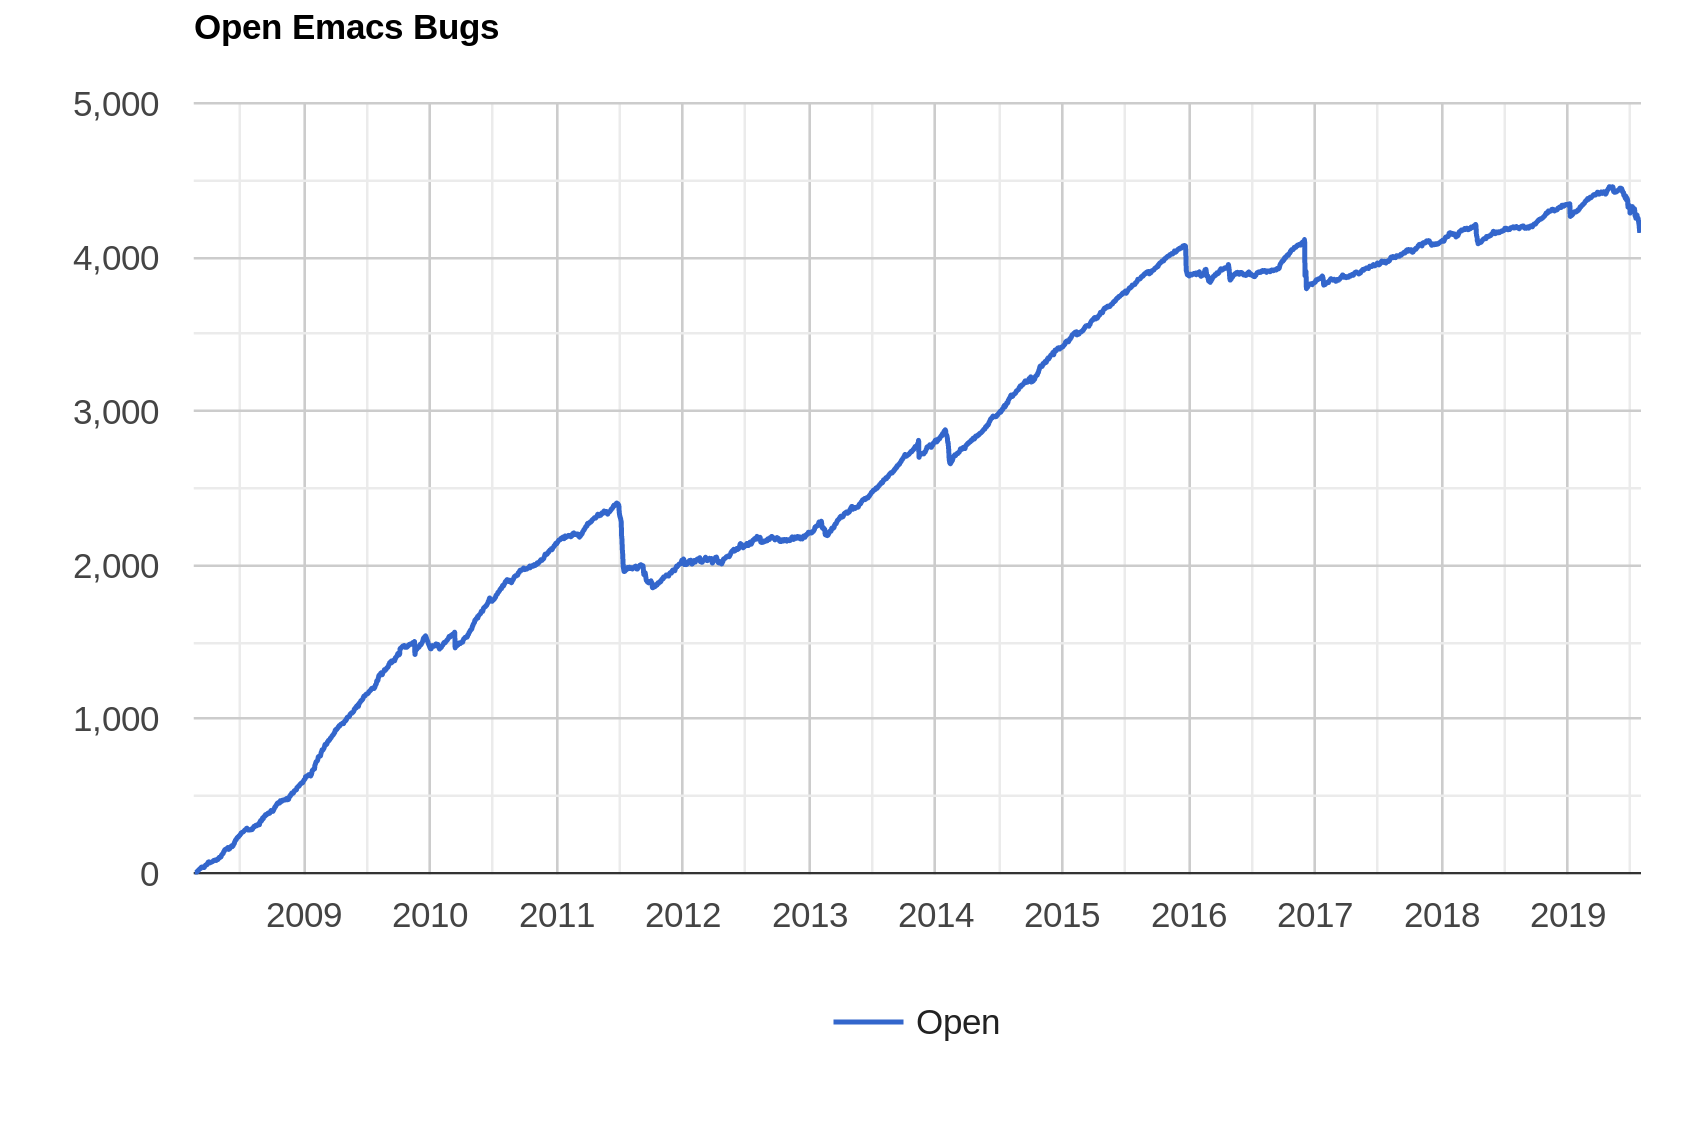
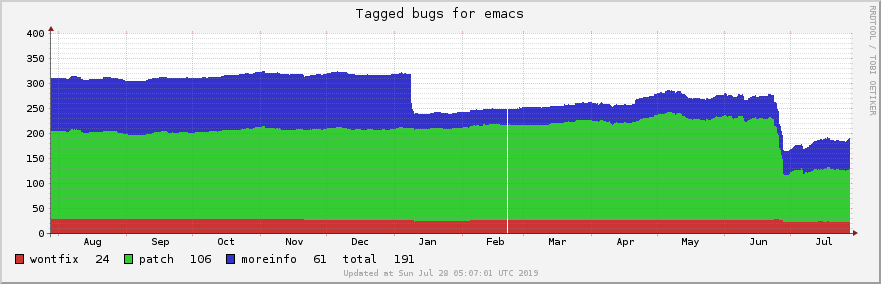
Things are the same! The chart showing the number of open Emacs bugs has been remarkably flat over the last three years; three cheers for the Emacs maintainers and all their helpers!
But is this because there’s fewer bugs reported?
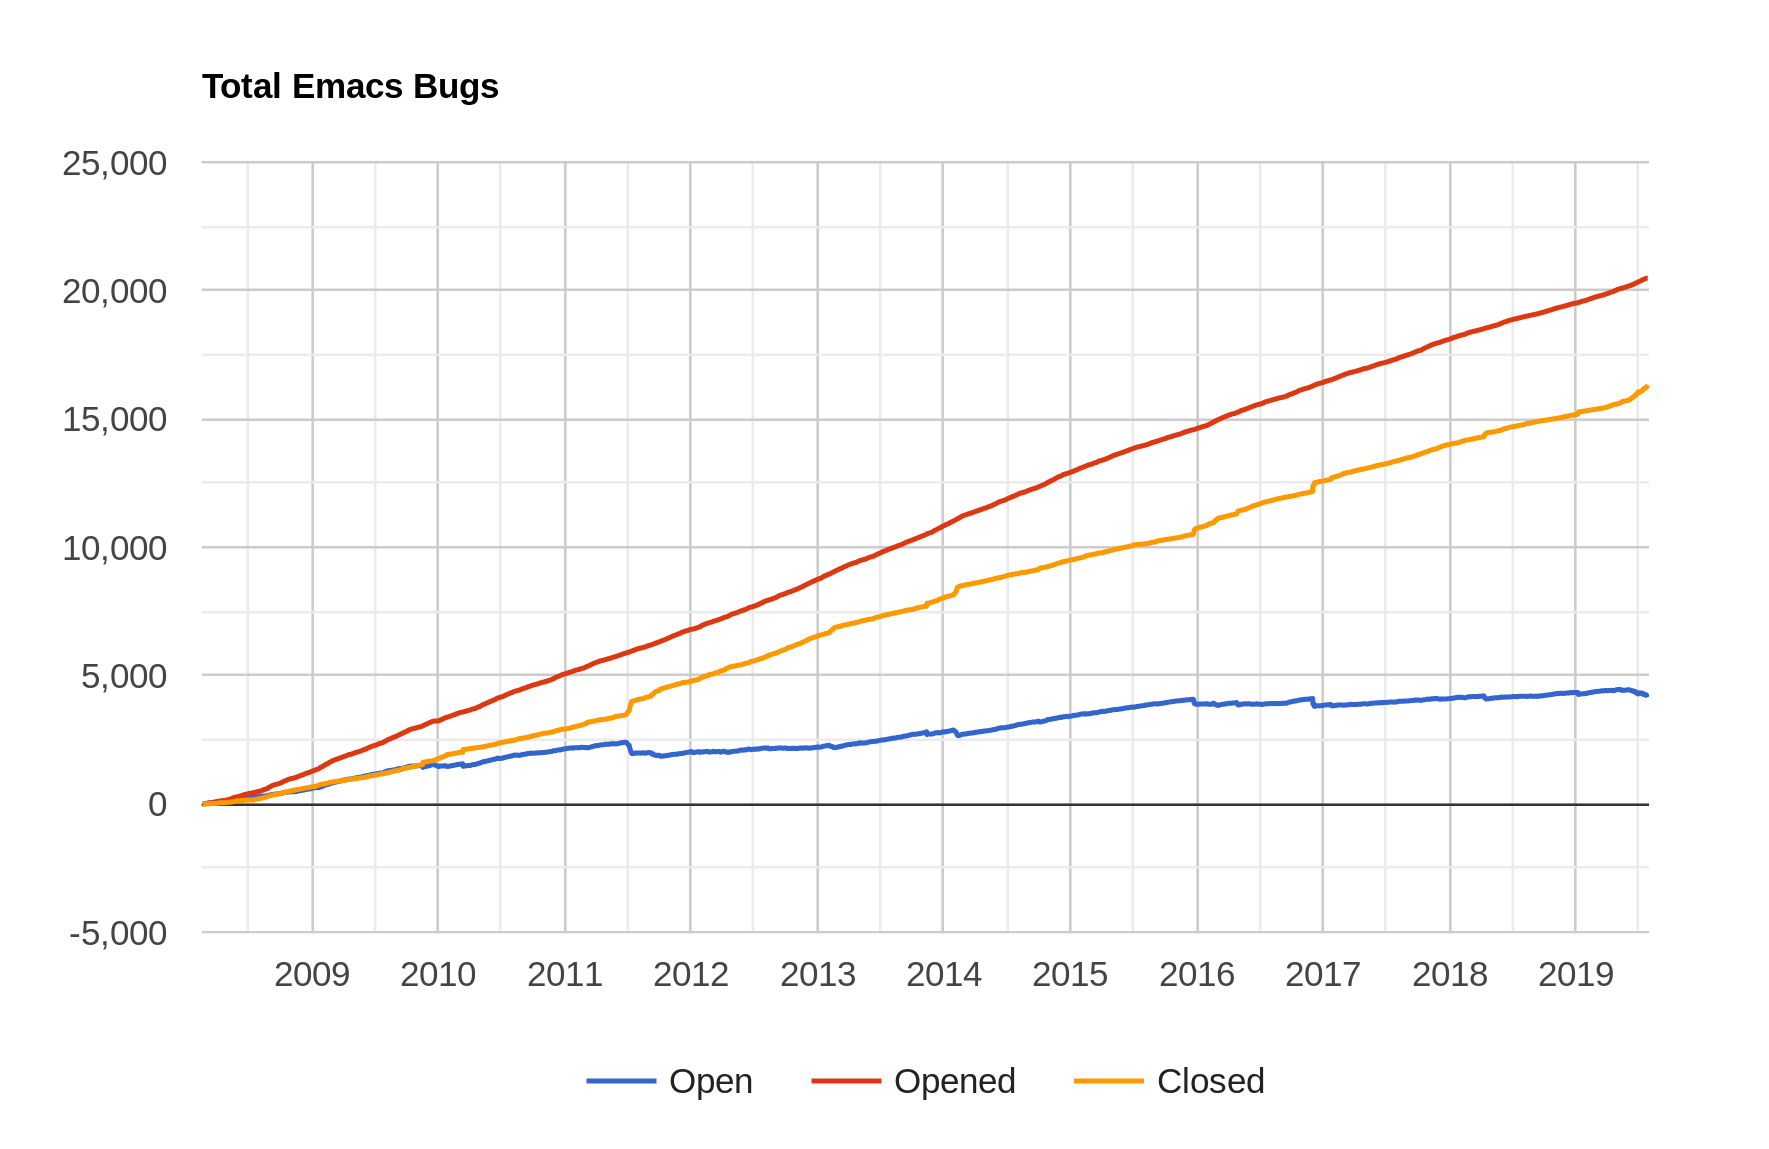
Hm… No, that red line (opened bugs) is almost a straight line, so it’s about fixing things and closing bug reports at a steady pace. (Interactive charts here.)
So let’s look at the number of commits and contributors:
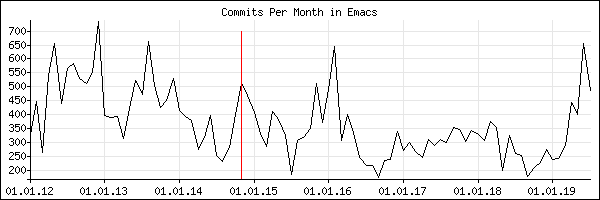
Surprisingly enough the number of commits per month hasn’t been very large; about 300 per month. (The red line is when Emacs moved to git from bzr.) Or perhaps that’s not surprising; the fewer commits, the fewer new bugs?
In a longer perspective:
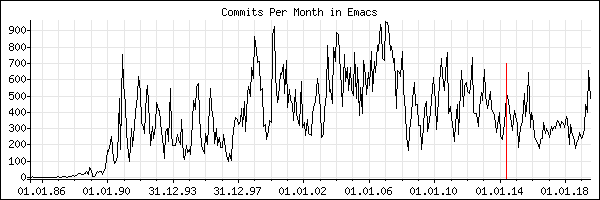
And here are the equivalent charts for the number of contributors:
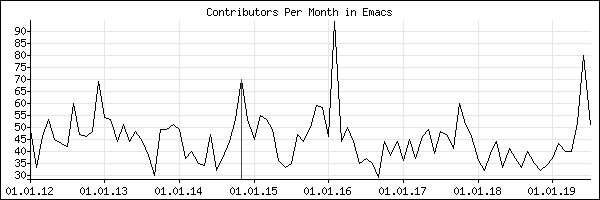
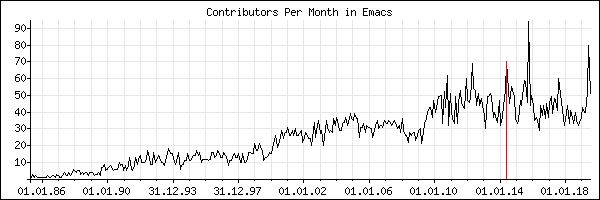
Pretty steady at about 35 per month. (The recent spike is just me spelunking through the bugs database and applying a bunch of older patches that were submitted and not applied at the time they were submitted.) Or as the Emacs bug tracker graphs put it:
And in other Emacs-related news, I thought it was really amusing to see The New York Times using Emacs as an example when educating people about commit messages, and it was doubly amusing that the author used a commit message of mine when doing so.
So now I can say that I’m a New York Times-published author.
If it wasn’t for the small detail that that would be grossly misleading.
In conclusion:

Here’s a picture of some potatoes.