Whaa… it was less than a month ago I did one of these last time?

Down to 2141 from 2260.
Er… what to talk about this time… Uhm… (Oh, for new readers, this is a blog post series where I look at Emacs development through the lens of doing bug triage and fixing and closing and stuff.)
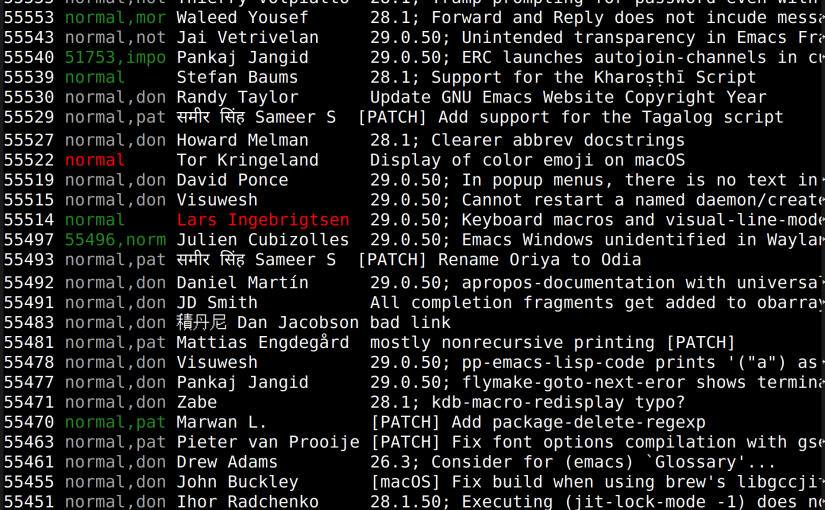
OK, let’s look at this:
That’s the debbugs-gnu overview of about one week’s worth of bug reports (the newest one when I screenshotted this). The second column has the status — the red ones have gotten no response, the grey ones have been closed, and the green ones have had some response (but haven’t been closed).
So, looks like we’re getting most new reports handled. It’s about 45 reports, and about ten of them are patch submissions, and only two of the patches haven’t been applied yet. So that’s nice.
And… they all have importance “normal”?

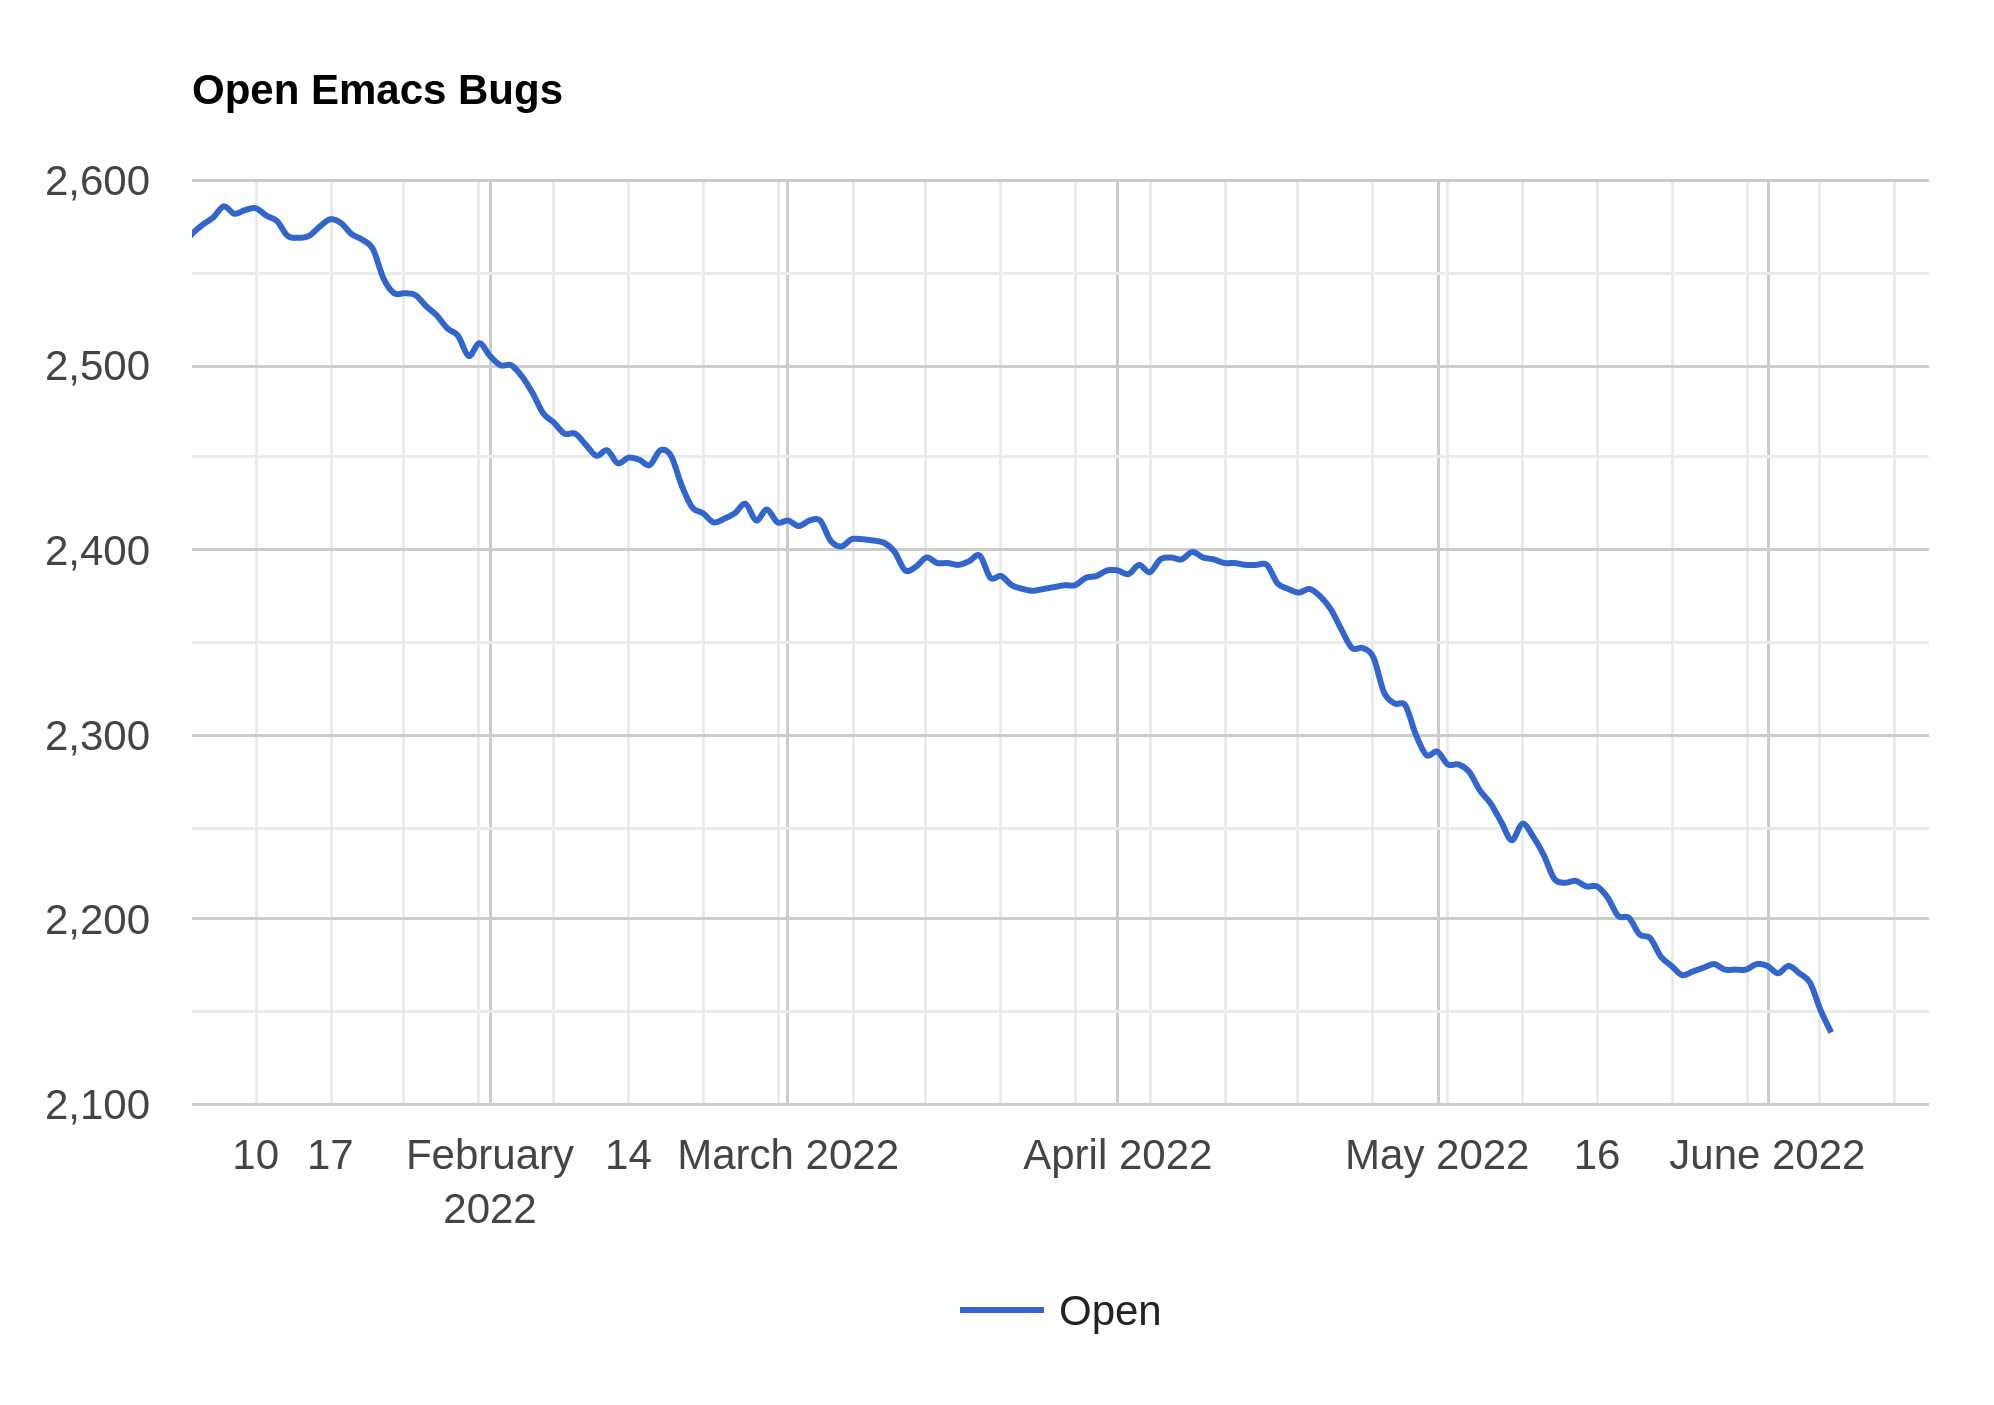
I wondered whether anybody was ever going to ask about what’s up with this chart, since it does seem that we’re basically only closing minor/wishlist items, right?
Up until a couple years ago, there was a (small) handful of people that were quite active in setting bug levels — skimming quickly, it seems like we ended up with about one third each of normal/minor/wishlist (with a smattering of important and critical). But it seems like those people grew bored with doing that (literally) thankless task, and nobody else has stepped up, so 97% of all bugs the last few years land at the default “normal” level. And as we’re fixing old bugs (which are diversely tagged), the chart seems to indicate that “normal” is constant while the rest are trending downward.
Statistics, eh? Such fun.
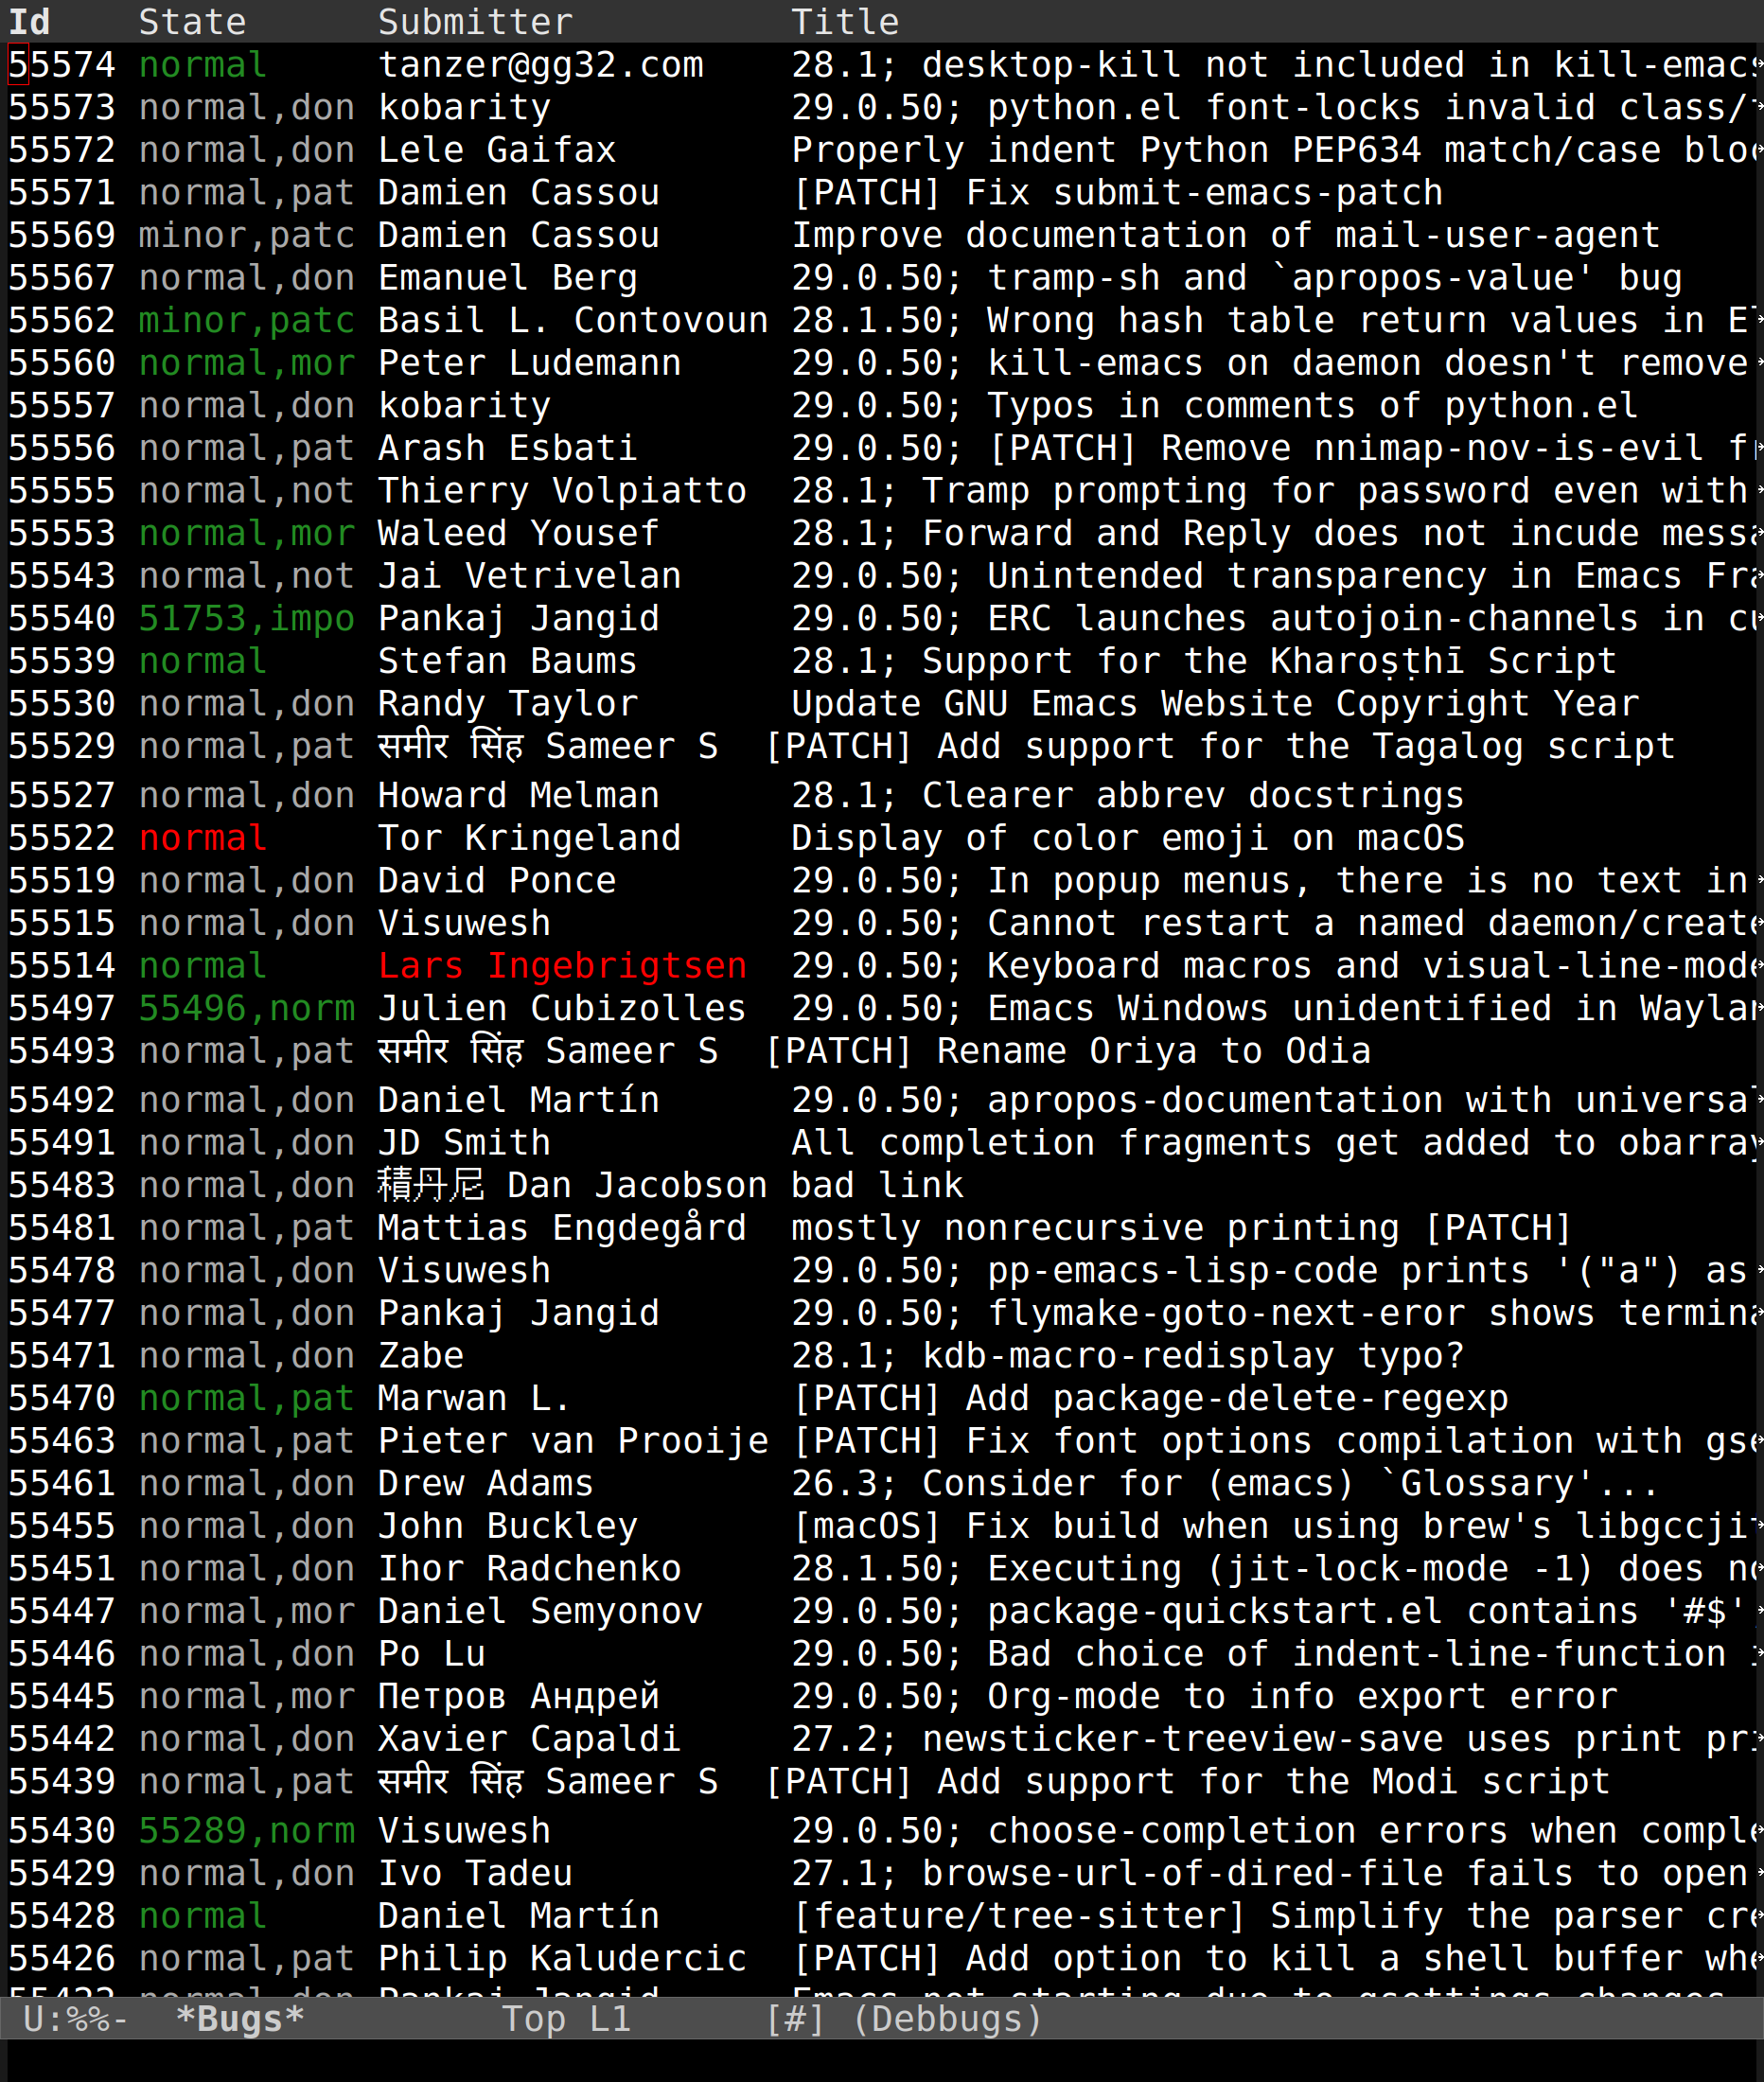
Anyway, this time around I’ve also been poking at the Emacs build machinery. It’s not a very unusual one — it’s a GNU Make thing with some autotools sprinkling. But while it supports parallel makes in the normal way, there’s also some things that are implemented as single-threaded jobs, and the Make scheduling unfortunately makes some of these things run when there’s nothing else to do. If you’ve ever said make -j32 to sit staring at this for 30 seconds:

Then I have good news: I reimplemented that algorithm (which took 30 seconds during the make bootstrap process, scheduled on its own with -j32 on a fast machine, interleaved with some other jobs on machines with fewer CPUs).
And it now takes two (2) seconds.
I’m not a maths person, but that’s an improvement of a lot of them there percentages.
On my main build machine, a make -j32 bootstrap is down from 2m21s to 1m52s, and on the laptop where I do most of my Emacs work, is down from 4m35s to 4m15s.
(The reason it was so doggone slow was that the code was geared towards keeping already-generated loaddefs files updated, so it would look for autoload statements in the source code, see whether they were already present, and then gingerly try to insert them in the right place. The larger the loaddefs file, the slower, etc.)
So after doing that, I wondered whether anything could be done about the other major single-threaded thing in the build process — the scanning of the Japanese dictionary to create a data file. And I suspect there might be, but it’s way out of my field of expertise: I don’t really know what it’s doing. However, nothing really depends on it being built, so it can be postponed until we’re doing the main byte compilation run (and being run in parallel).
Changing a handful of Makefile.in lines brought the build machine -j32 build time from 1m52s to 1m28s and the laptop -j8 build time down from 4m15s to 3m33s, so these fixes give us a total build reduction of somewhere between 30% to 20% to… less, depending on how many cores you have and how fast they are.
Which made me wonder: How has Emacs build times changed over the years, anyway? I set my build machine to work with this gorgeous one liner:
while [ $d -lt 1400 ]; do rm -rf bench; cp -a fresh-clone bench; cd bench; dat=`date -u -d "last Monday - $d days"`; git checkout `git rev-list -1 --before="$dat" HEAD`; git status >>/tmp/clog; echo $dat >> /tmp/clog; { time make -j32 2>/dev/null ; } 2>>/tmp/clog; d=$(($d + 7)); cd ..; done;
I.e., build every Monday going back two years. (Hm… writing this, I realise that I should only be logging the data when the build is successful — if it’s failing at some point, the timing data isn’t interesting…)
I ran each build three times and picked the median build time, and presto!
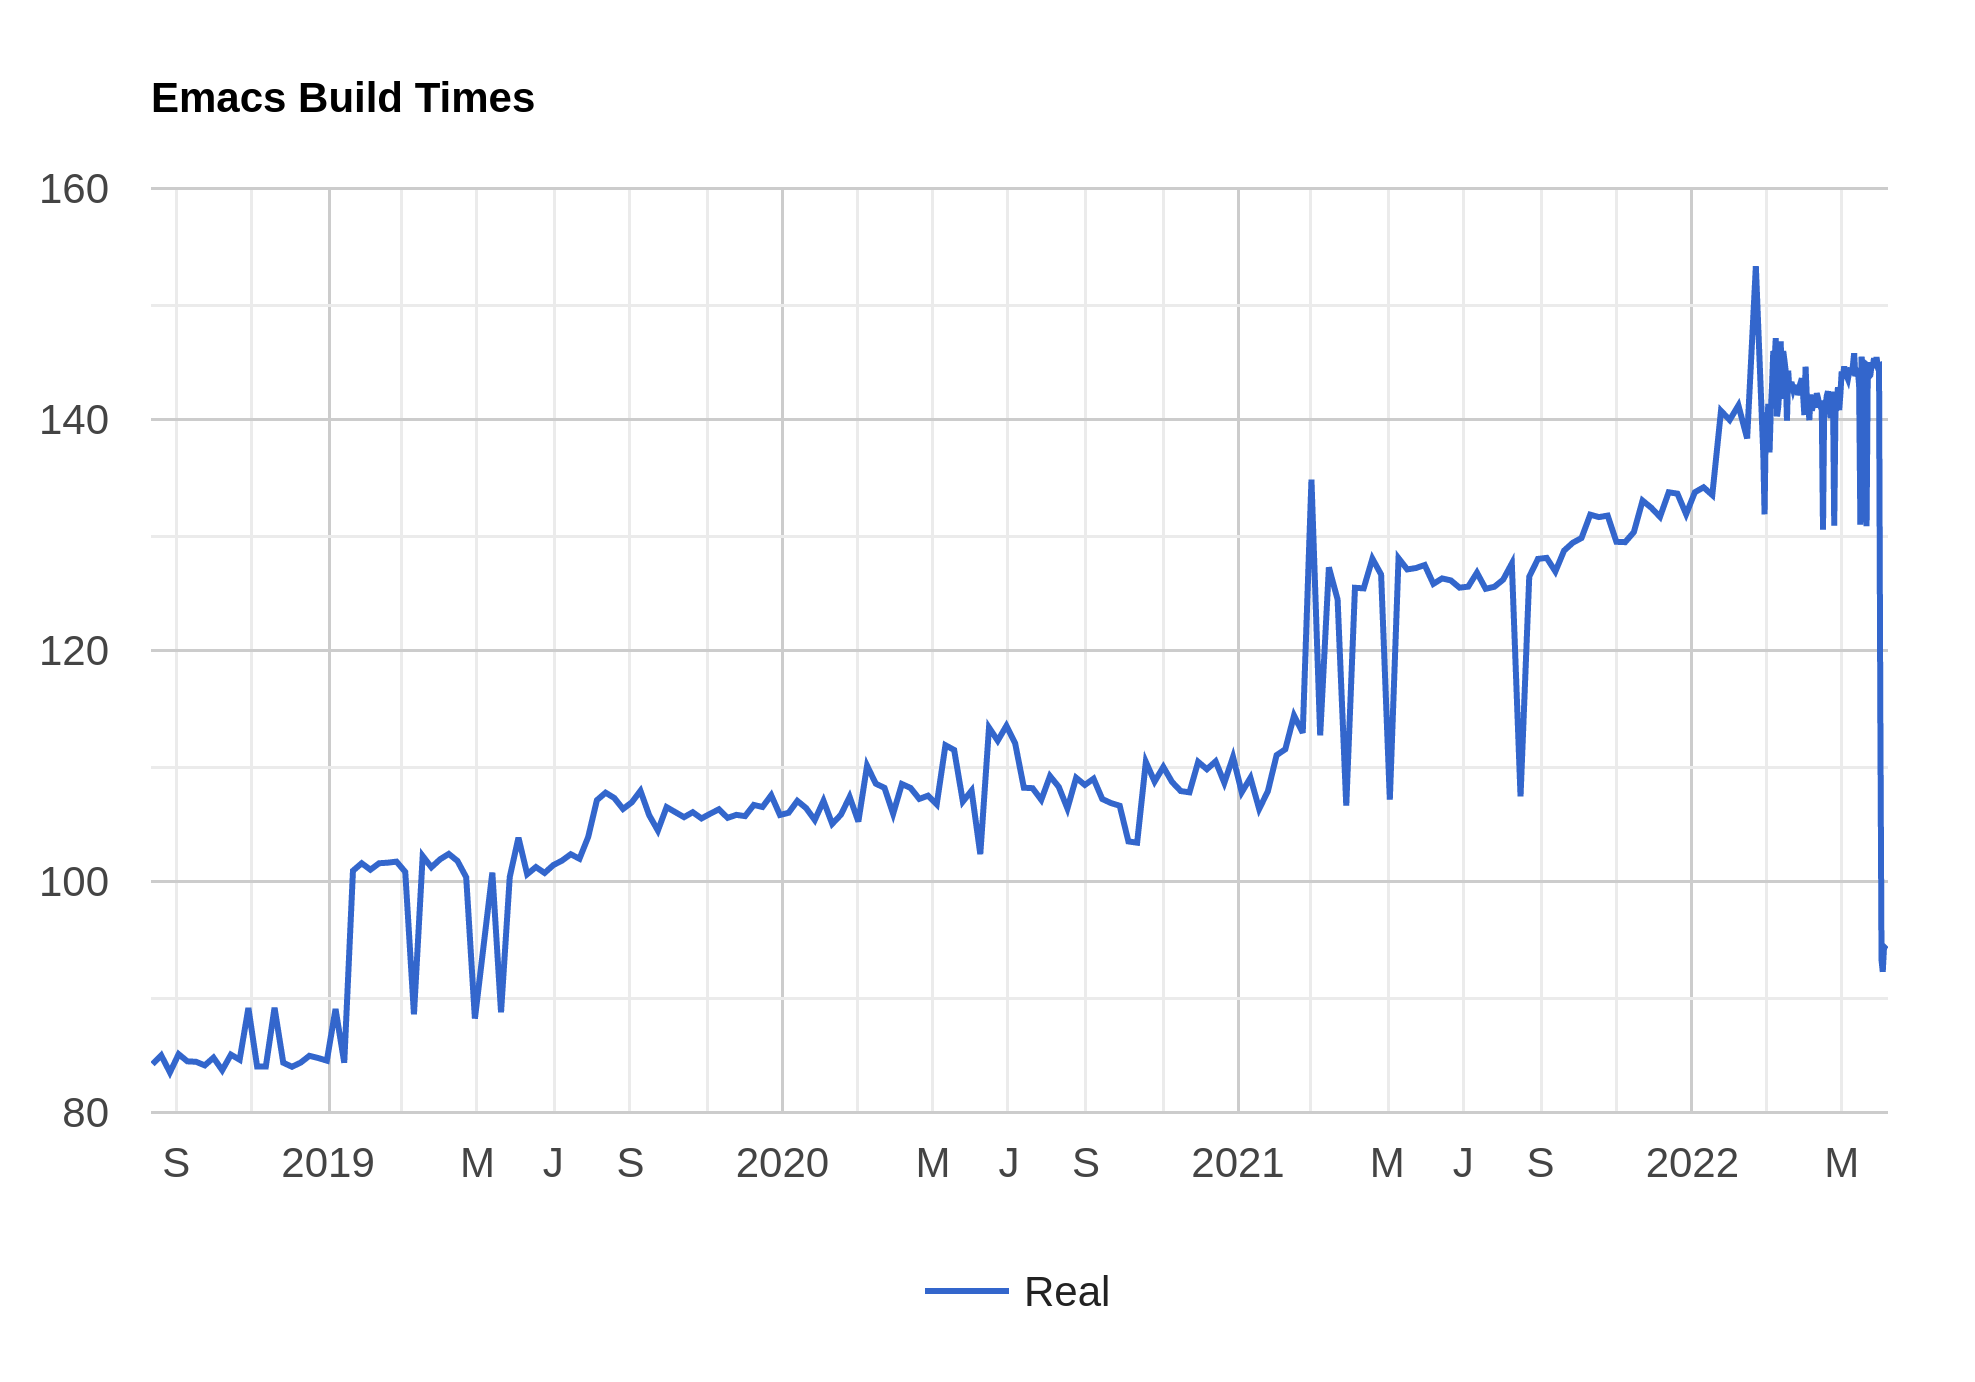
Indeed, things are taking a lot longer now than they did a couple years ago. (And, no, that’s not a glitch at the end there — that’s this week’s build time improvements.)
So I think it would be interesting to look at the places where we had a definite jump in build times (for instance, Jan 2019) and see what happened. (Raw data here.) The changes may well be warranted, but it’d be nice to know, anyway. And why is the build oscillating +-20s over the last month?
Some of the bigger things may be due to making the build more/less parallel, so here’s the chart for CPU usage, too:

It’s less peaky, as expected, but tells basically the same story.
Anyway, did we have any new features in this stretch? Let’s see… Not anything, major, but we’ve gotten support for a whole bunch or scripts: Tai Tham, Brahmi, Kaithi, Tirhuta, Sharada, Siddham, Syloti Nagri, Modi, Baybayin, Hanunoo, Buhid, Tagbanwa, Limbu, Balinese, Javanese, Sundanese, Batak, Rejang, Makasar, Lontara, Hanifi Rohingya, and Grantha, courtesy of समीर सिंह Sameer Singh and others.
It’s otherwise just smaller things all over the place, like M-SPC being bound to (an improved) cycle-space and package-update-all and… well, read the NEWS file diff yourself.
Anyway. Next bug stretch is just 214 bugs. Onwards and downwards. But I might take a holiday this time for real I mean it.
i can tell you as a longtime emacs user who occasionally submits bug reports, the responses i get have always been timely and useful. it is an *impressive* level of support.