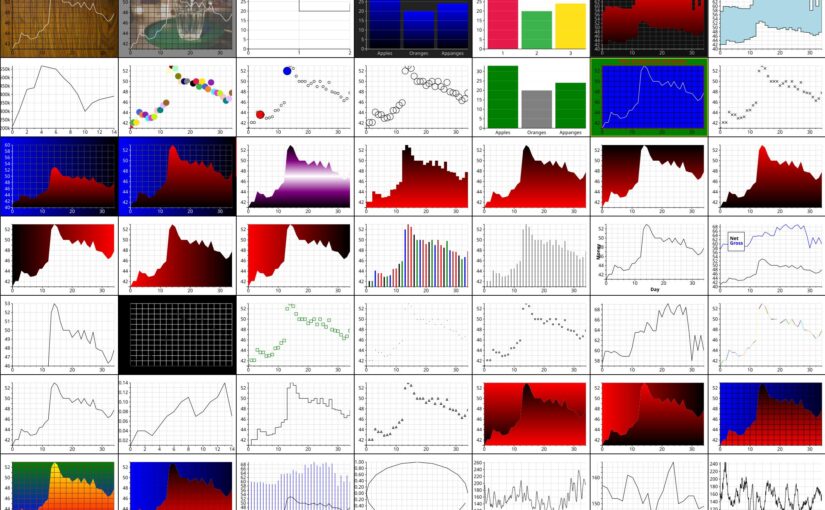
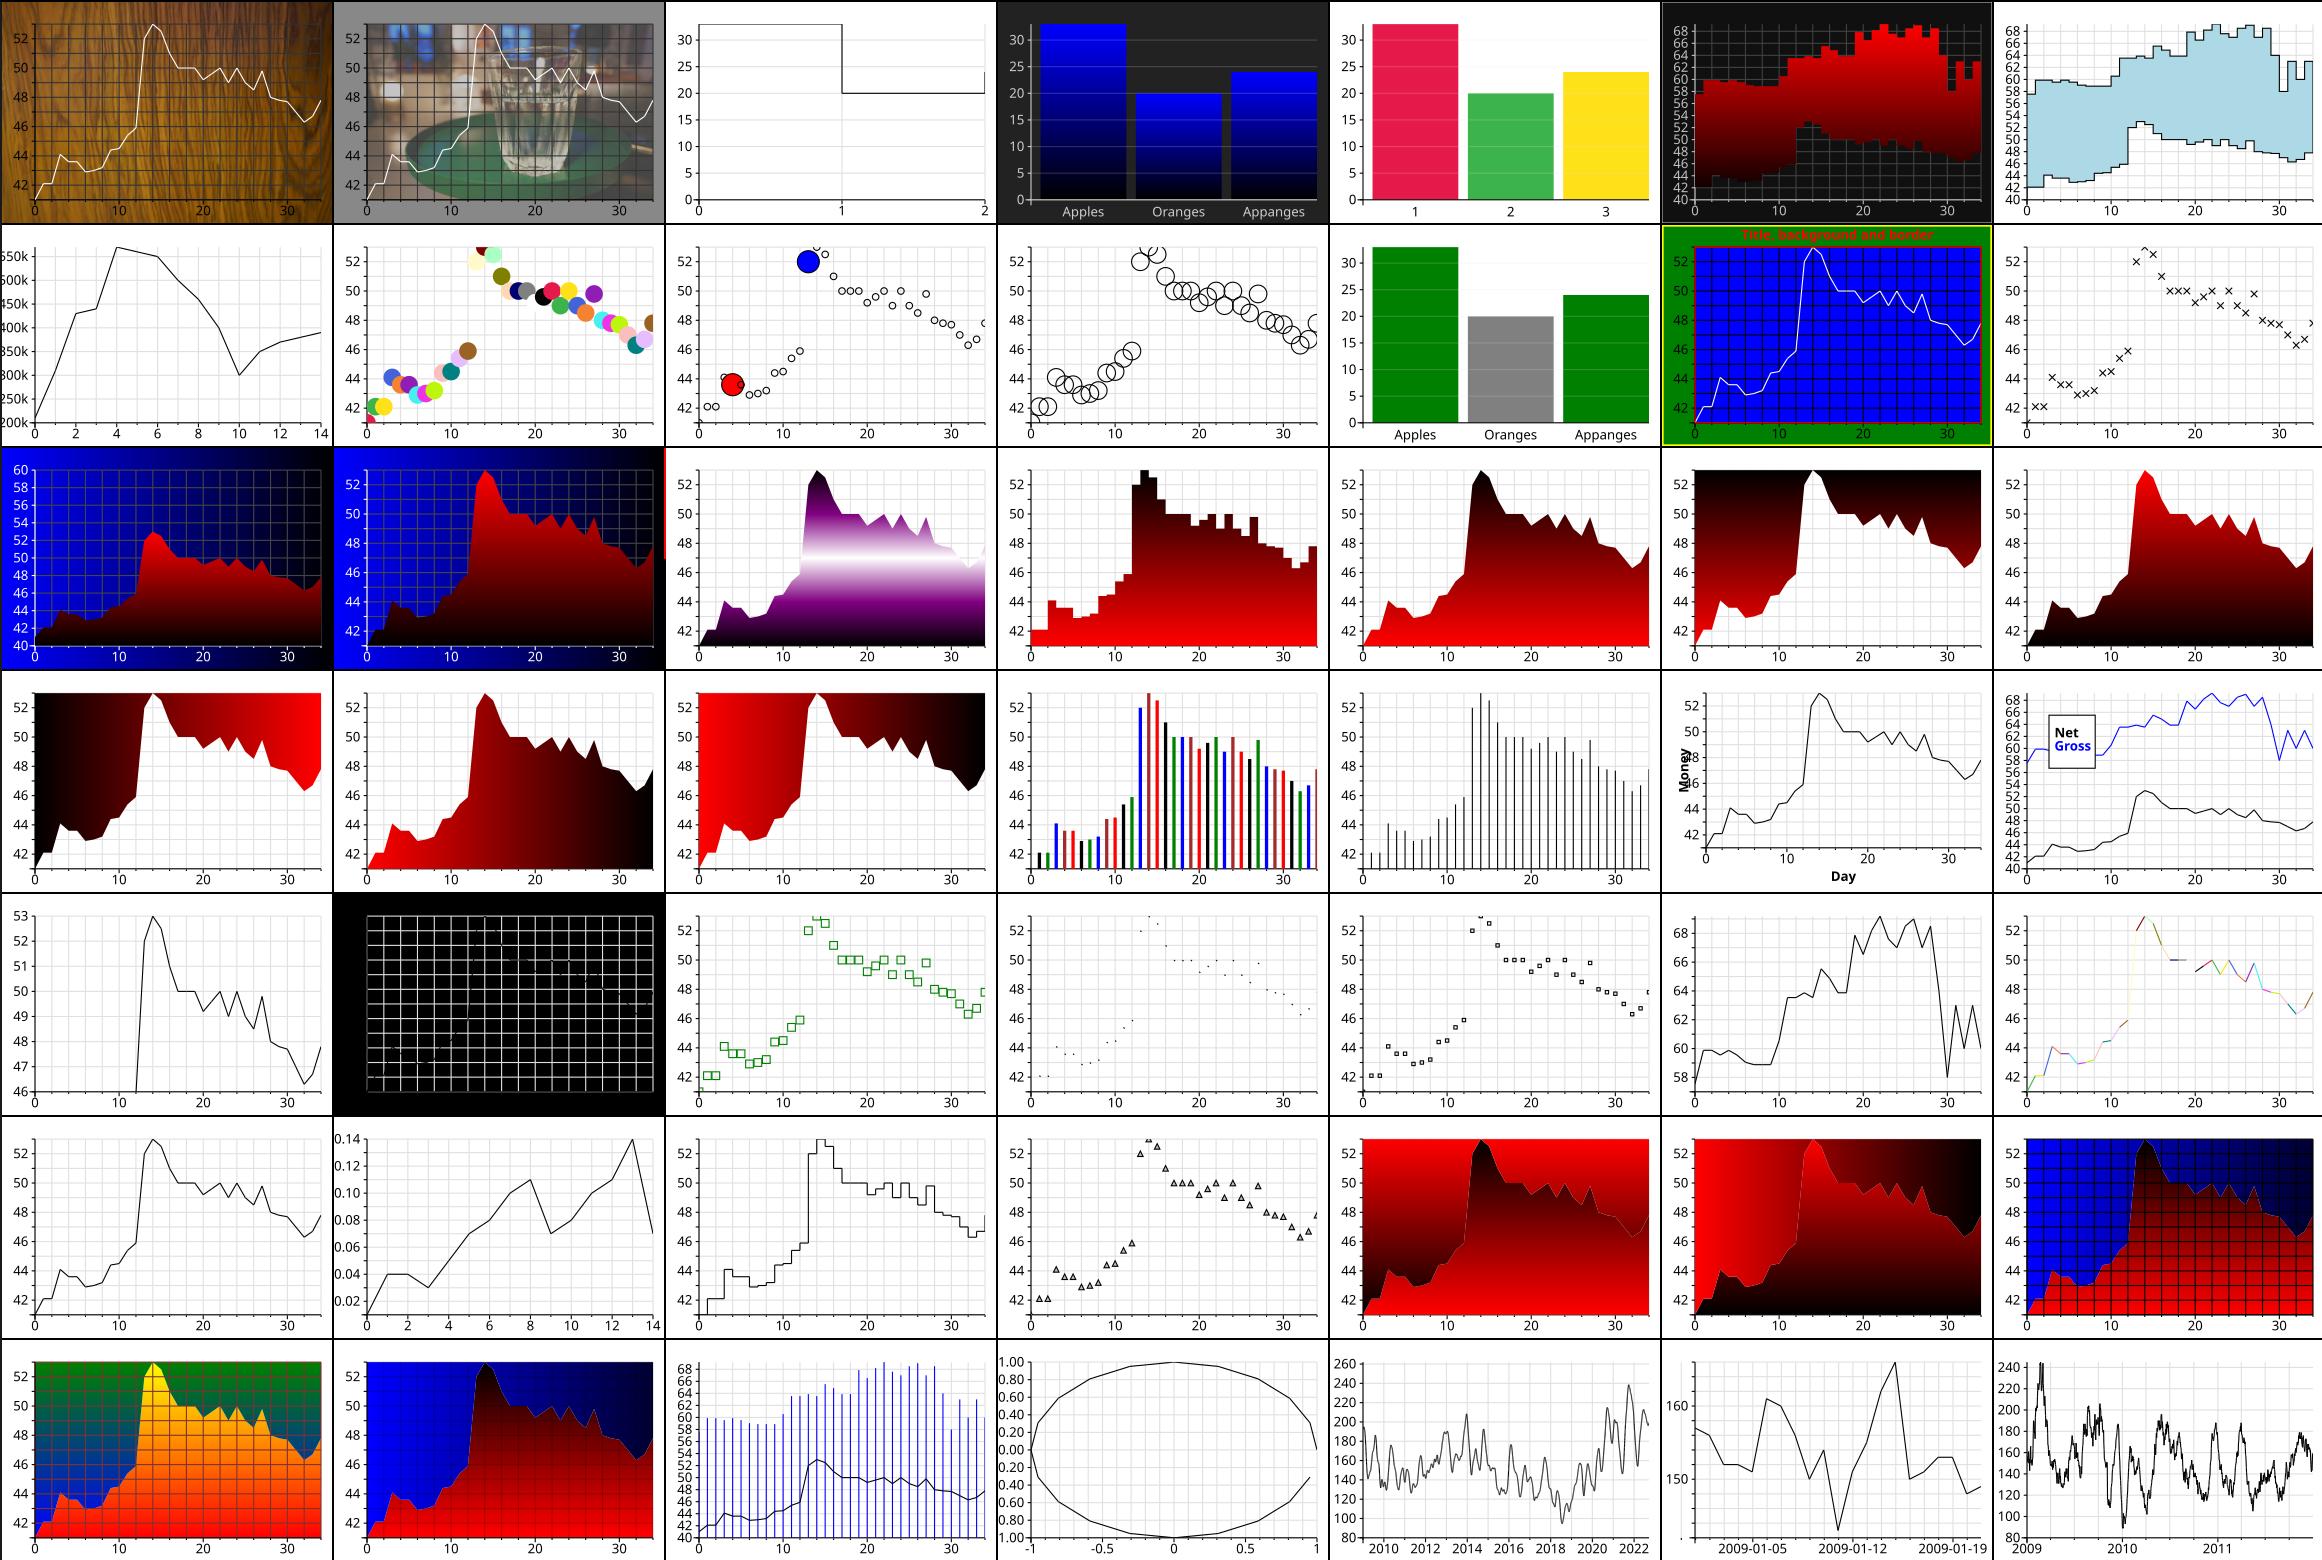
A few days ago I pushed a new library for making charts interactively in Emacs to Microsoft Github. One suggestion was to use transient or something to allow customising the look of the charts instead of adding headers to the data buffer.
Which makes a lot of sense — you don’t want to alter the data just to plot something. But on the other hand, I didn’t really know what it’d look like — for UX stuff, you really have to just try.
Behold! The most thrilling video in the history of videos! That are thrilling!
And… It’s got discoverability going for it, but it seemed to take kinda a long time? OK, let’s try the same with headers (this is an unrehearsed screen recording, but of course I know what the header names are, kinda sorta):
That took as long, really.
Anybody else got ideas here? More interactivity would be nice, and of course I could see resizing the chart with the mouse or something, but how do you express “raise the grid to the front of the chart and make it less opaque”?
Perhaps a double tap triple finger swirl counter clockwise. Yeah, that’s how Steve Jobs would have done it.


Personaly I prefer the transient ui for not inventing a new file format.