Back when I wrote eww, the Emacs web er wrangler?, I was futzing around a lot with basic input box functionality. Like this:
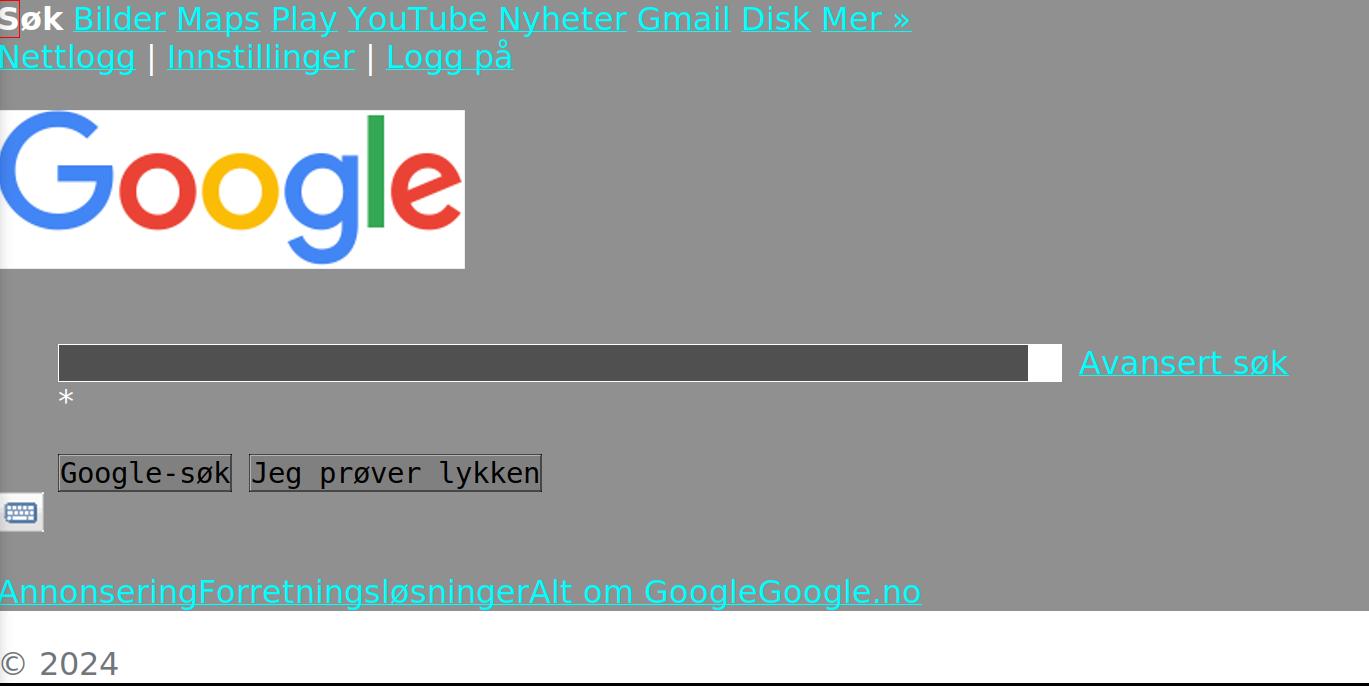
And it basically kinda works, but it’s easy to break, even if you don’t really try.
But that’s a bigger problem in user interfaces like this, where you have all these boxes that can’t really grow in size, because that messes up the display. But you have to be able to enter longer texts, so…
So I cheat, and move the second column down if the box gets too big. Eh, whatchagonnado…
I briefly contemplated making a real “scrolling input box” — that is, if you type in too much, then the text at the left disappears from sight. That’s easy enough to do, but then commands like `M-DEL’ doesn’t work right, and you really want all those nice Emacs editing commands in input boxes.
Hm… It occurs to me while typing this that perhaps this wouldn’t be impossible by judicious use of invisible text props — that is, if we’re typing too much, then make the left bits invisible so that it looks like it’s scrolling? And then reveal it if moving the cursor to the left… Urrr…
But! I’ve fixed a whole bunch of other bugs in the input box things, and I’m thinking I should separate that out into a separate package, and then adapt eww to use that… Possibly?
If it ever gets to a glitch-free state, that is. It gets many things right now, but there’s a ton of corner cases. It’s really fighting against the Emacs display/editing machinery — this is in a read-only buffer, but with inhibit-read-only text properties in the editable fields, and that’s not really… er… well thought through. But I’ll try to keep poking at it and see what happens — I’ve already been through four different iterations of the algorithm (read the VC log and weep), and it’s just hard — Emacs kinda really rebels against altering the text too much from after-change-functions, so you can’t delete/reinsert the field, but have to pad things gingerly to avoid having point go awry…
I’m not sure this will ever actually “work”, as in “not have awful corner cases”.
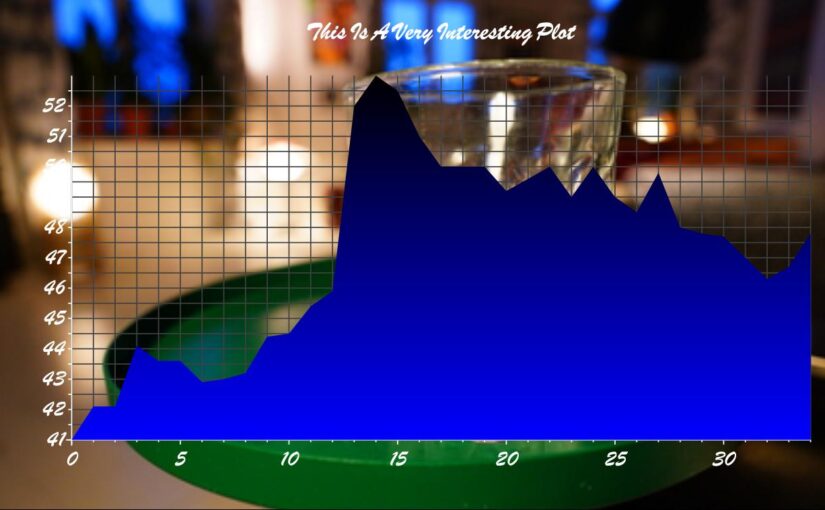
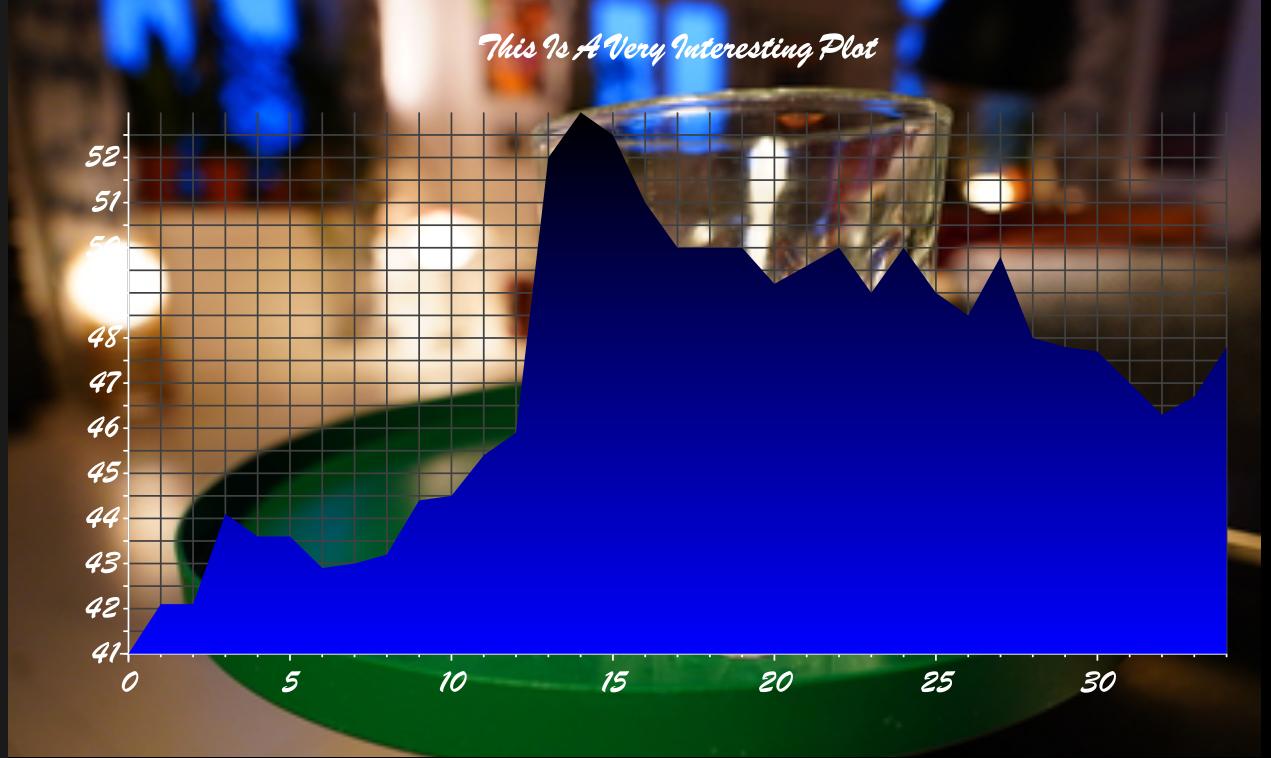
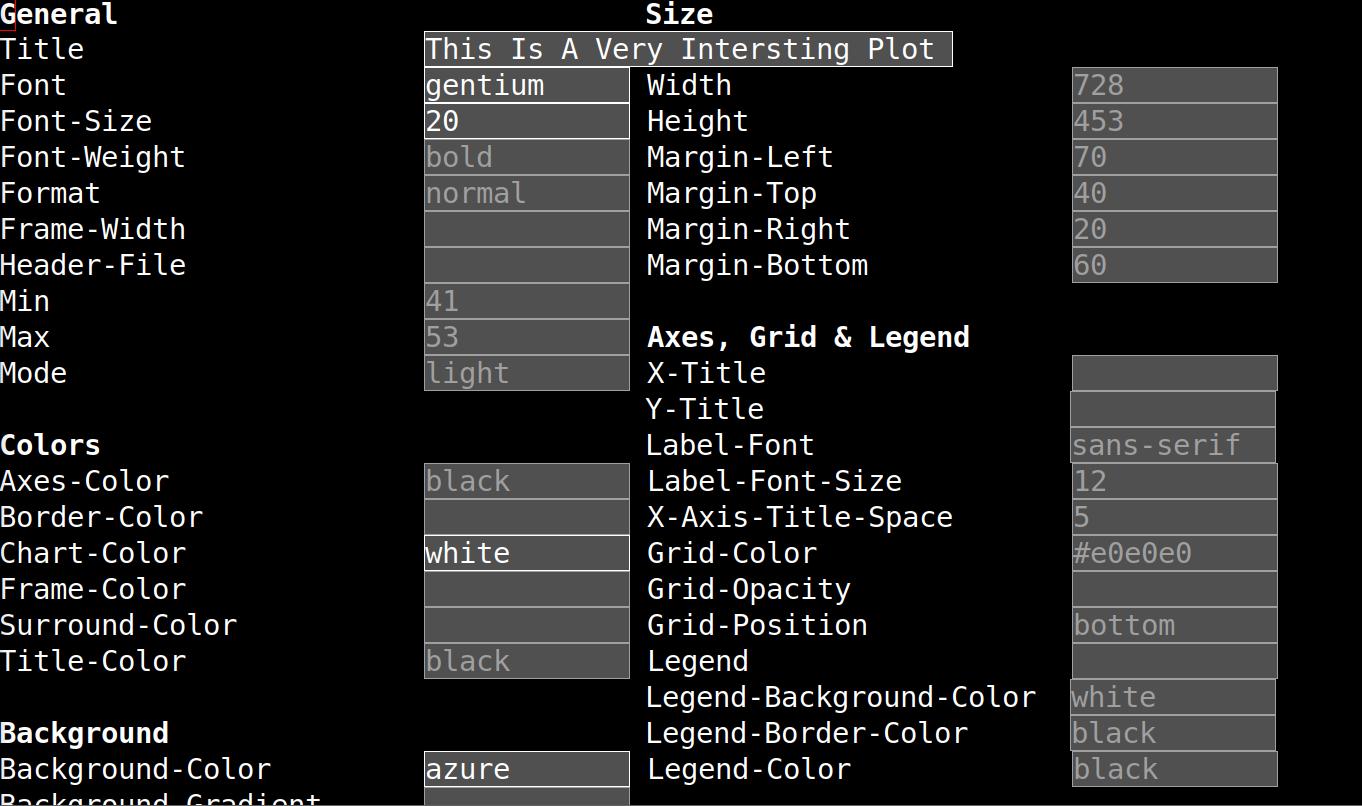
Anyway. I’ve implemented autocomplete in eplot for colours, faces, files and the like.
I think this interface for doing adjustments to the chart is getting to be kinda usable, actually.
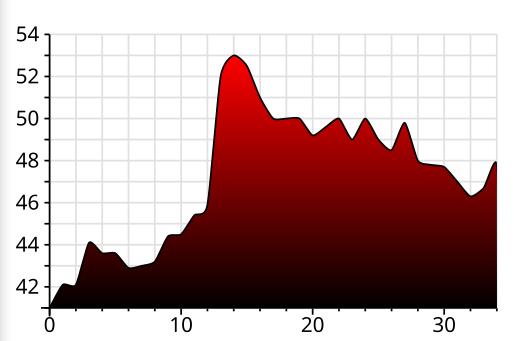
And I’ve implemented smoothed curves.
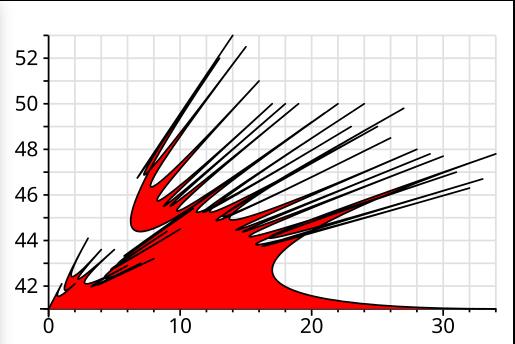
Kids, don’t try Bezier curves at home — you may end up with something like the above if you’re not careful.
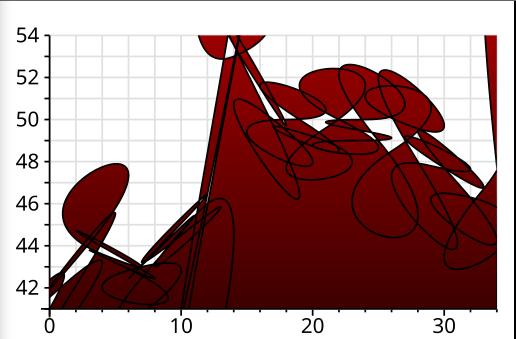
JUST SAY NO!
As usual when I’m implementing something, I’m starting to notice how others actually do that thing I’m doing (so that I can steal I mean get inspired).
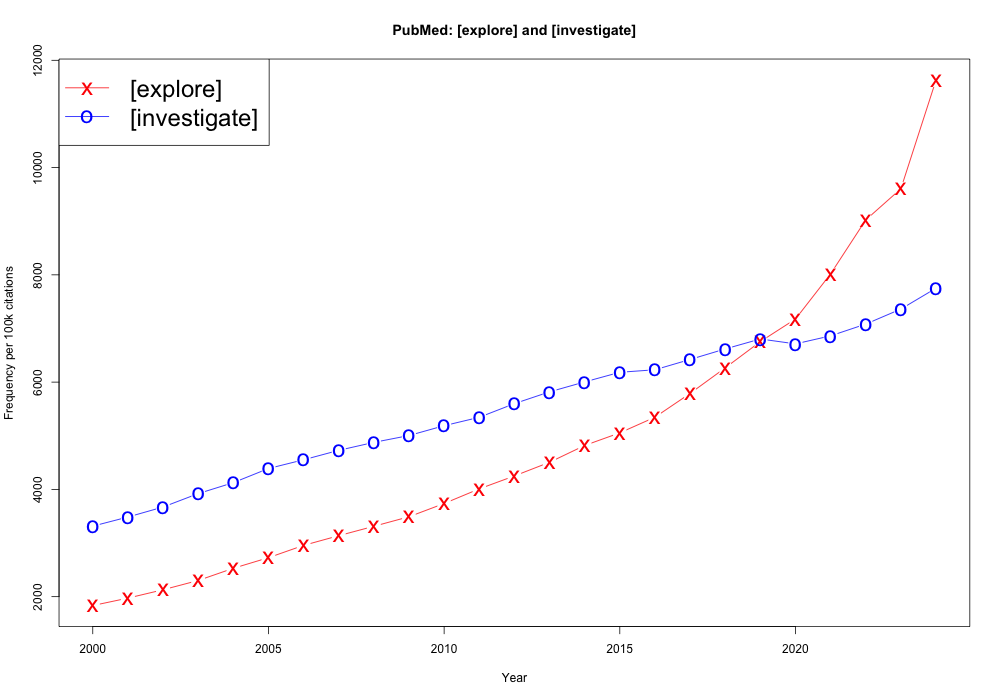
Here’s a chart from LanguageLog…
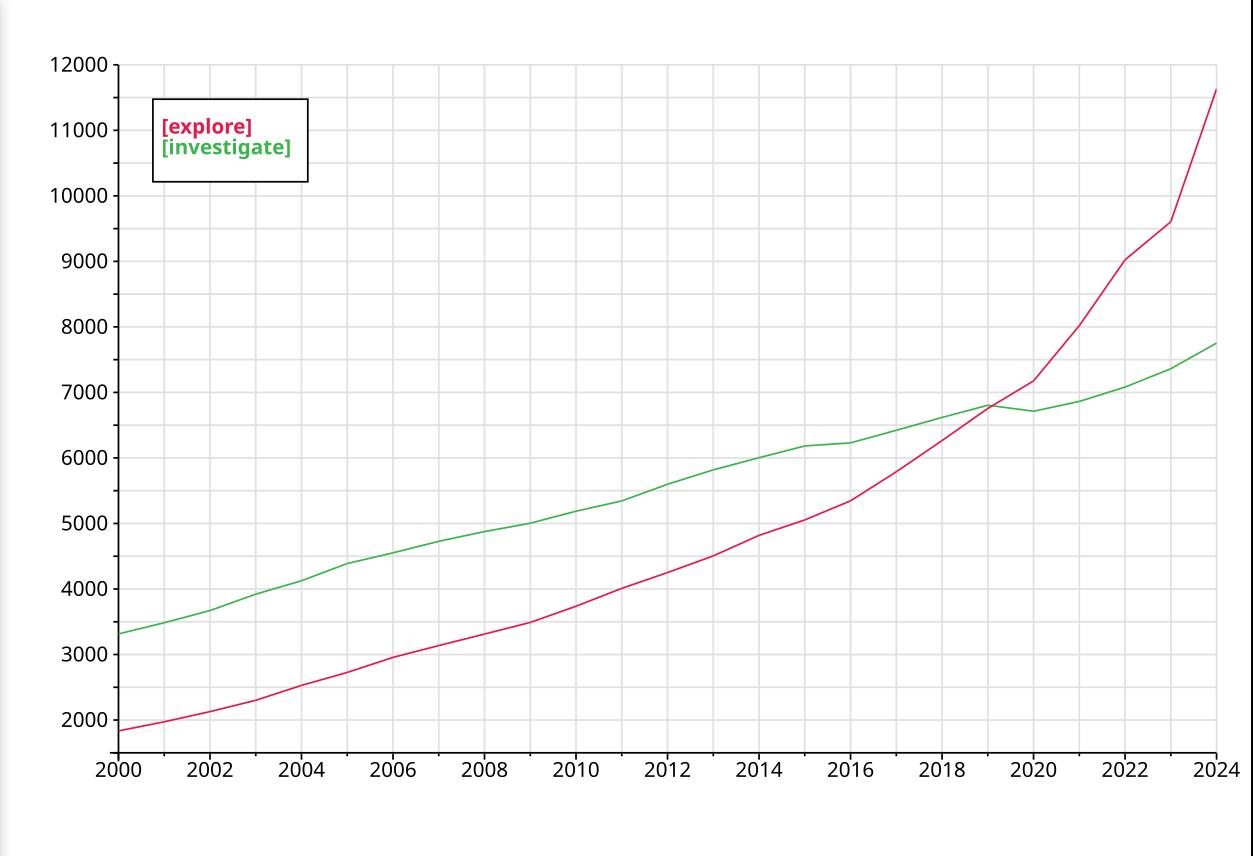
And here’s how `M-x eplot’ looks in the CSV buffer. (Yes, you can now plot directly from CSV buffers if you have the pcsv buffer installed.)
It’s kinda reasonable? Is the line-and-then-marker thing LanguageLog uses sensible? I think it looks a bit messy, but it does mark every “real” data point, which is nice… Hm.
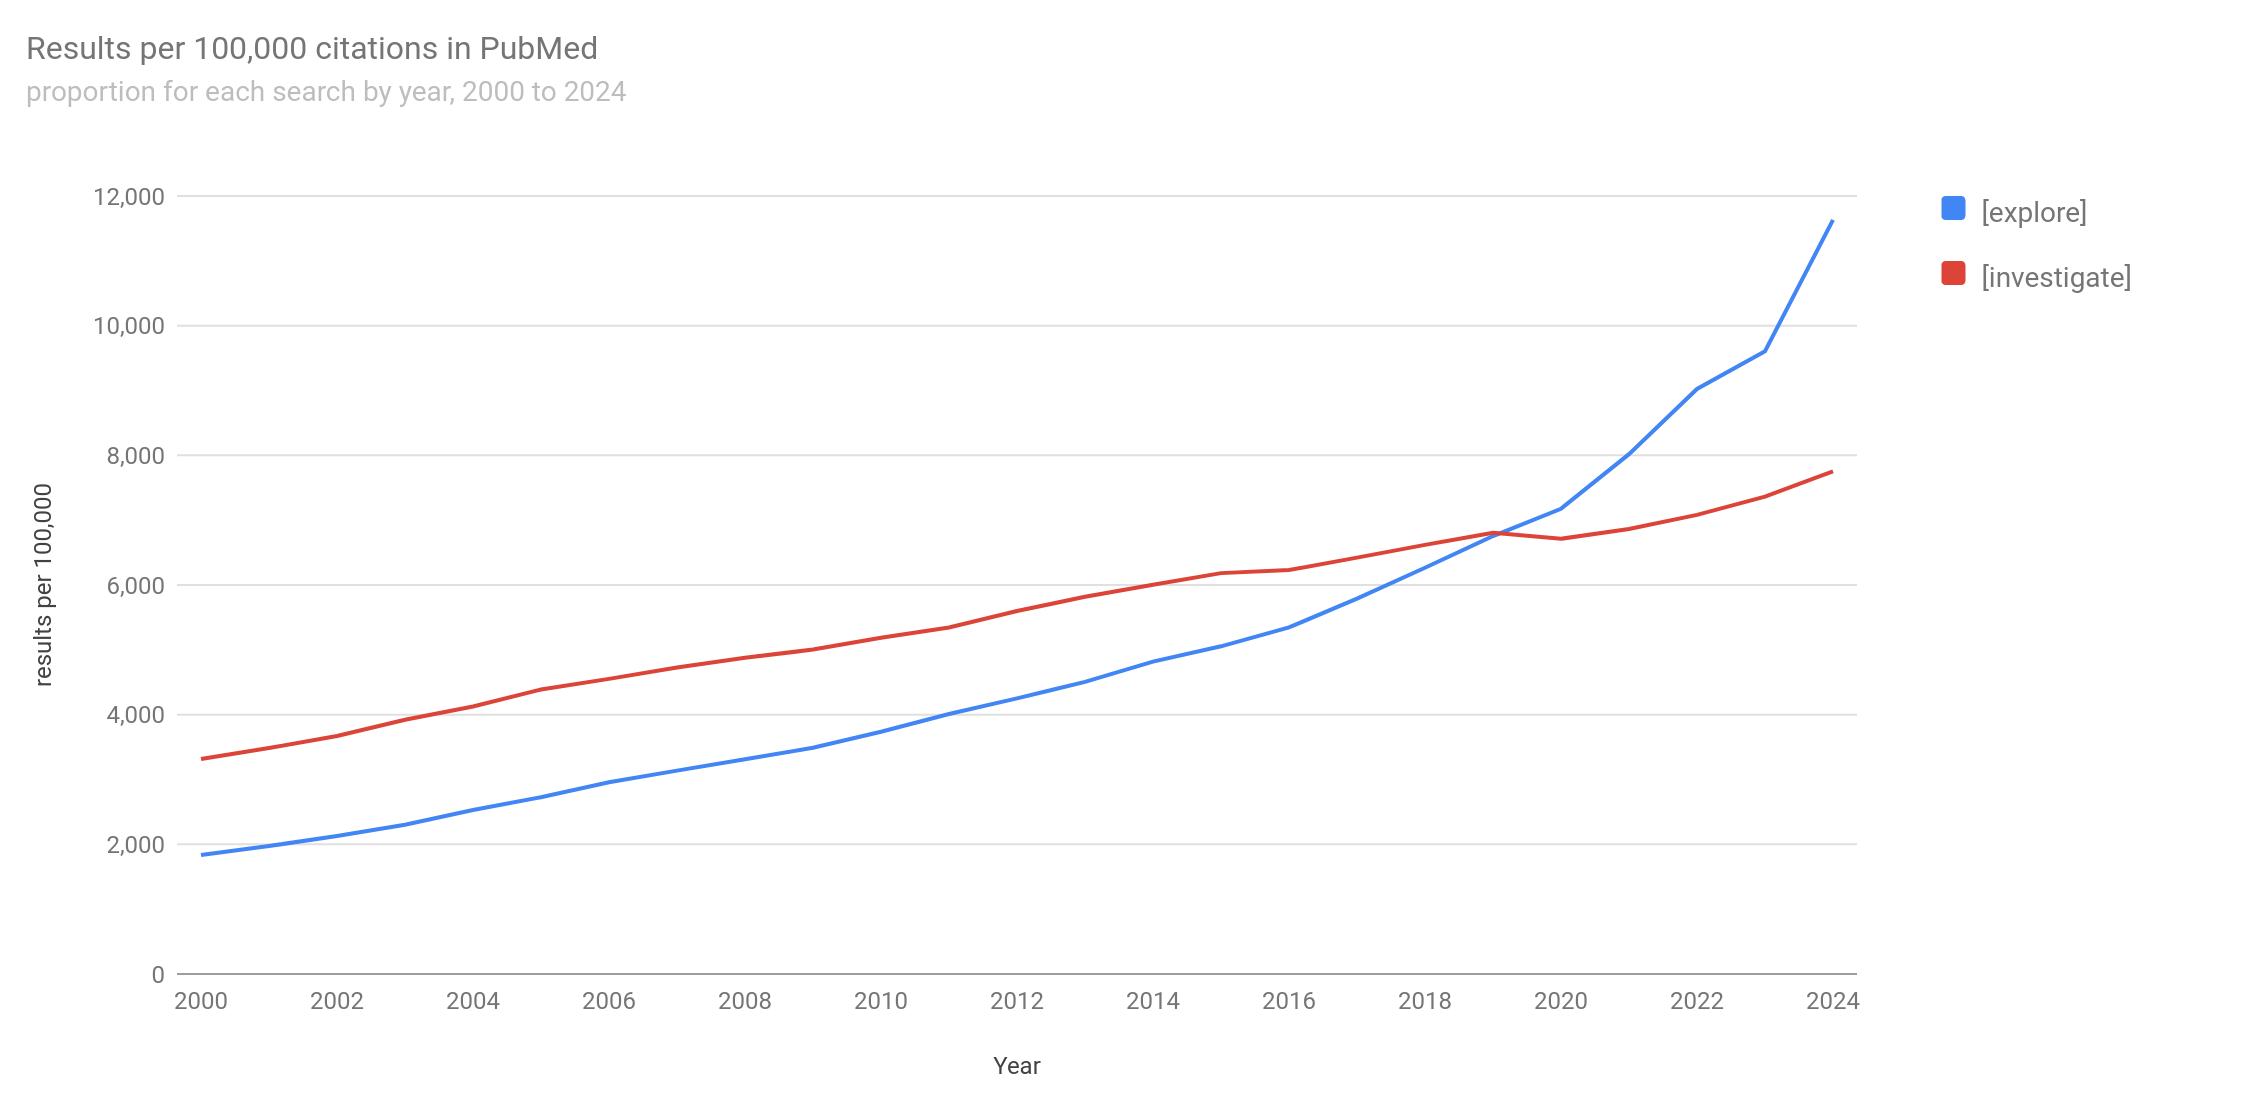
Here’s the same data from PubMed itself. Notably, they include origo. Both of these pick nice Y scales, but I guess it’s a matter of taste whether to include origo.
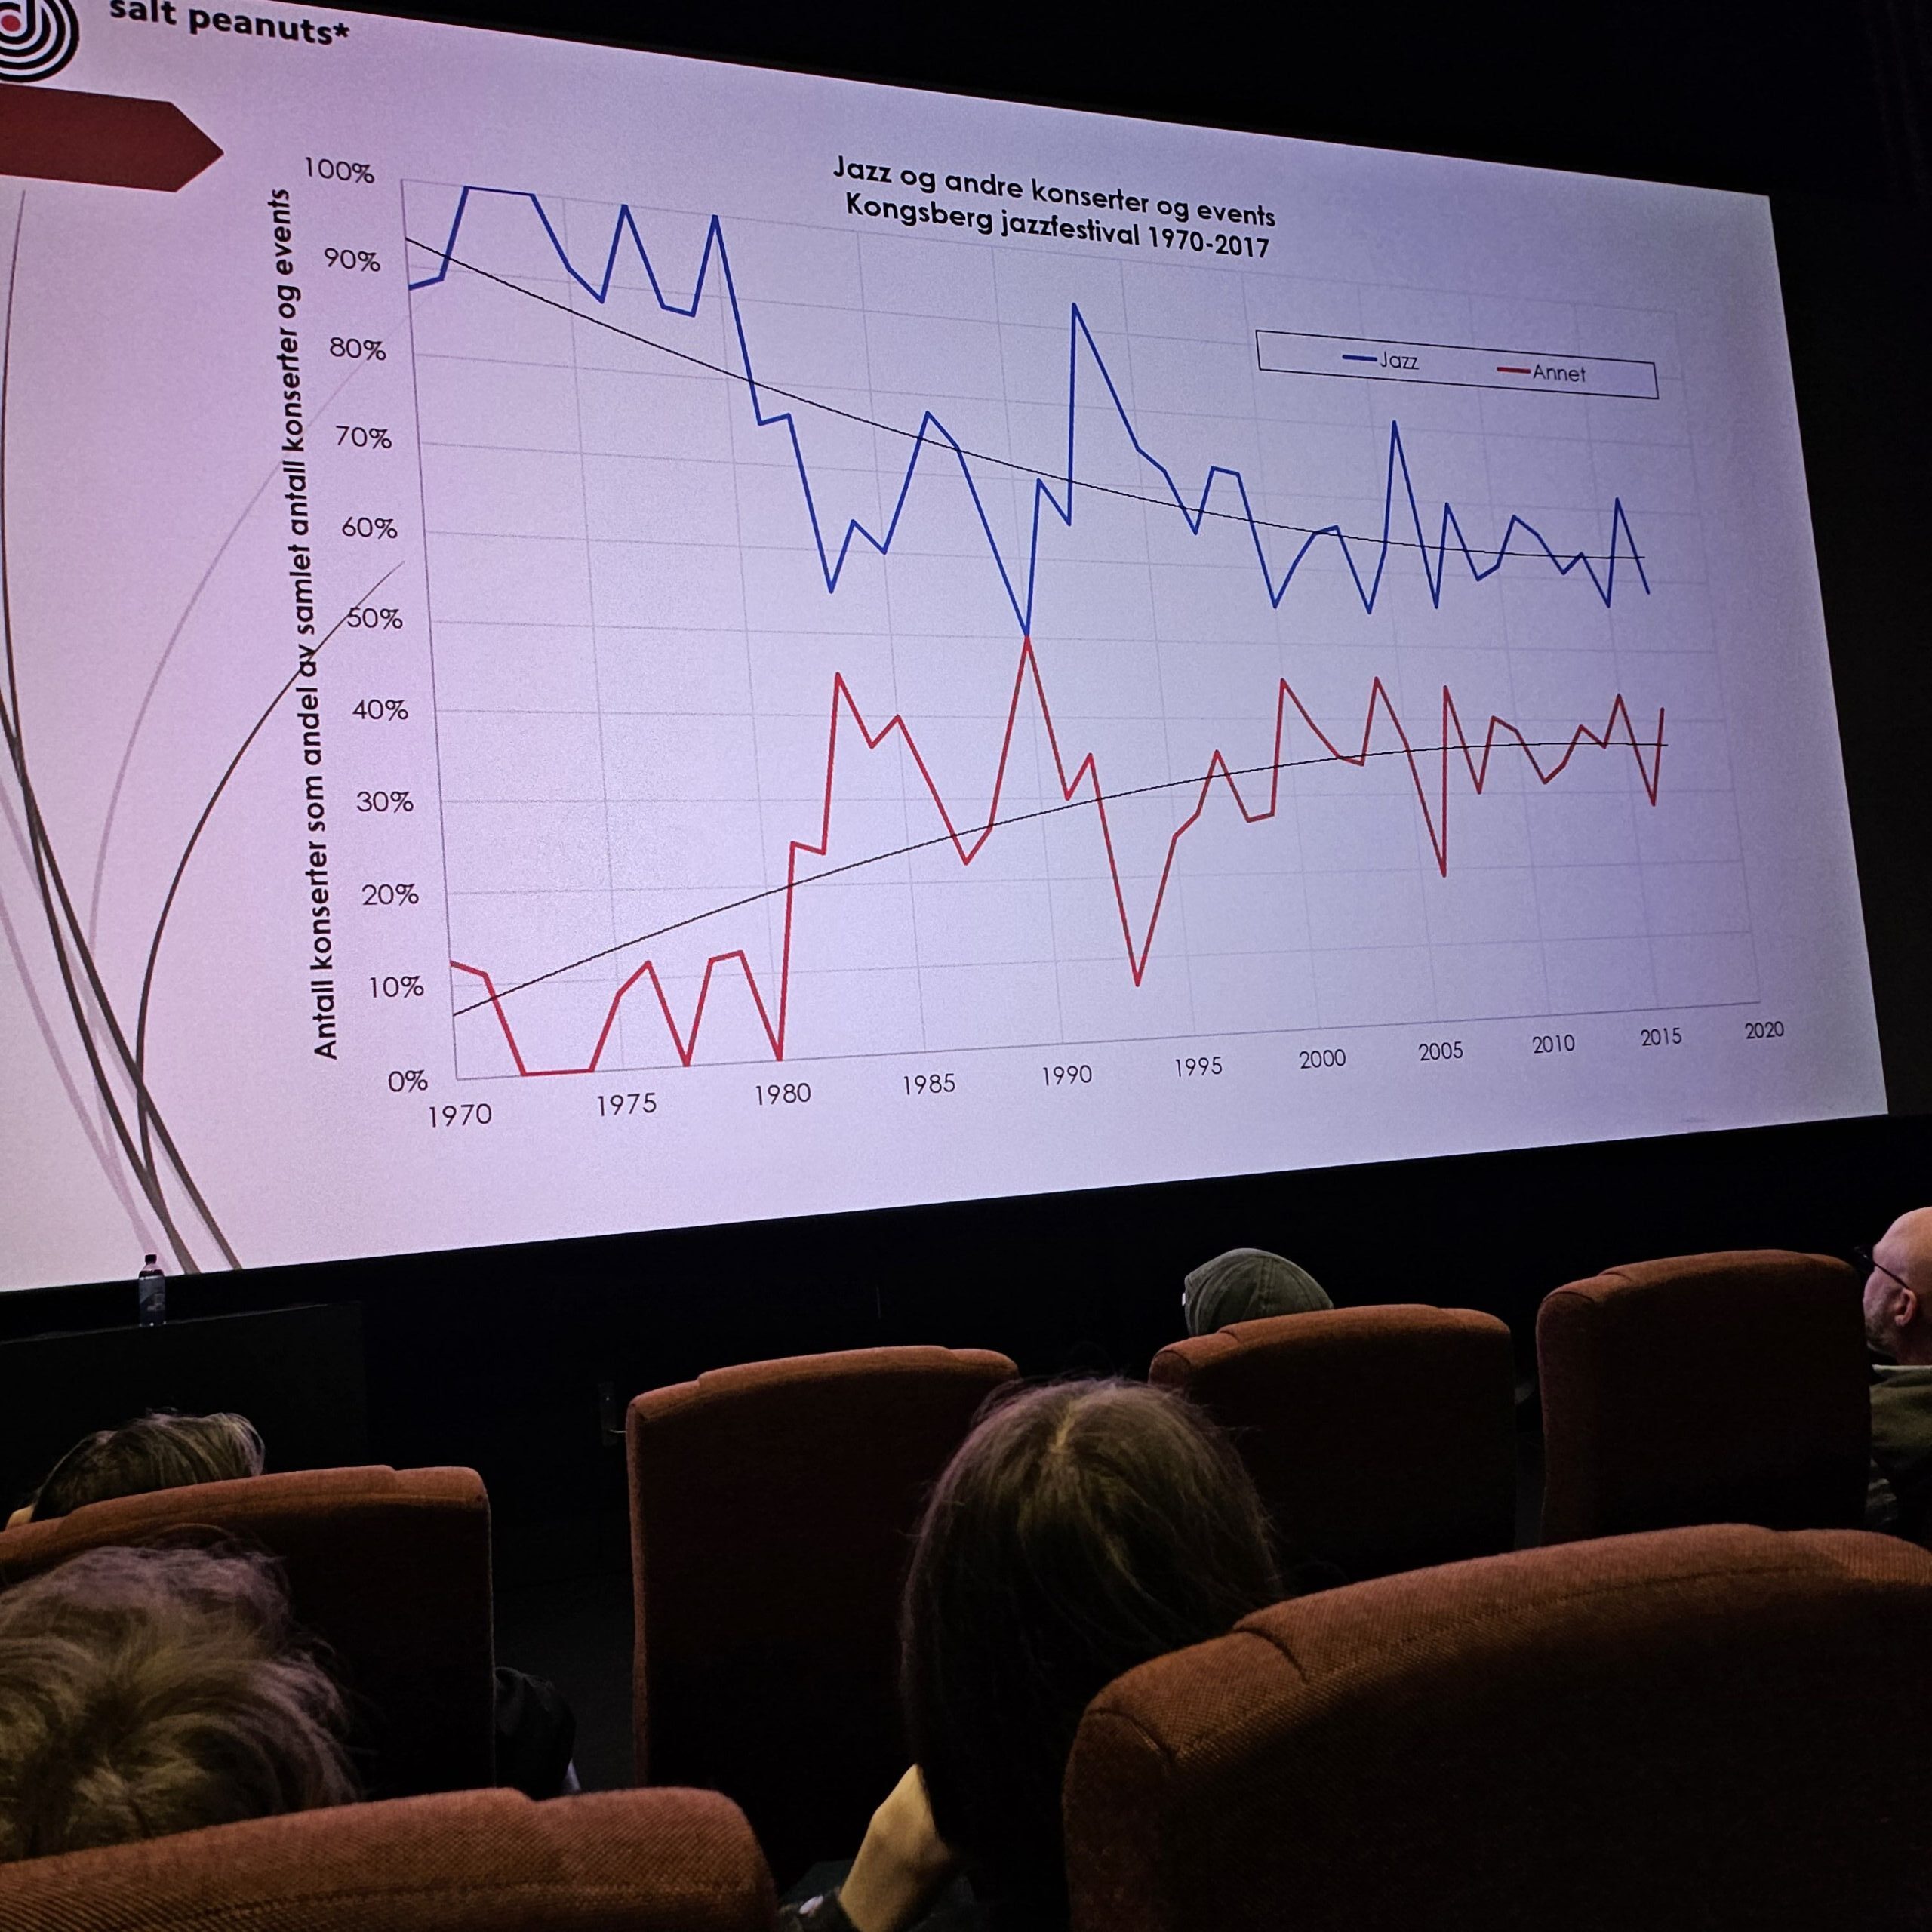
This jazz chart reminded me that it should be possible to include formatting of the X and Y labels, so I added that:
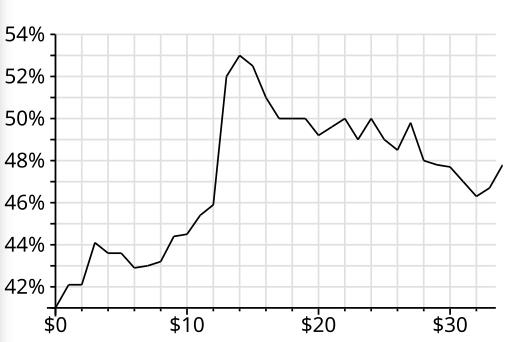
And here’s a thing that’s usual in finance:
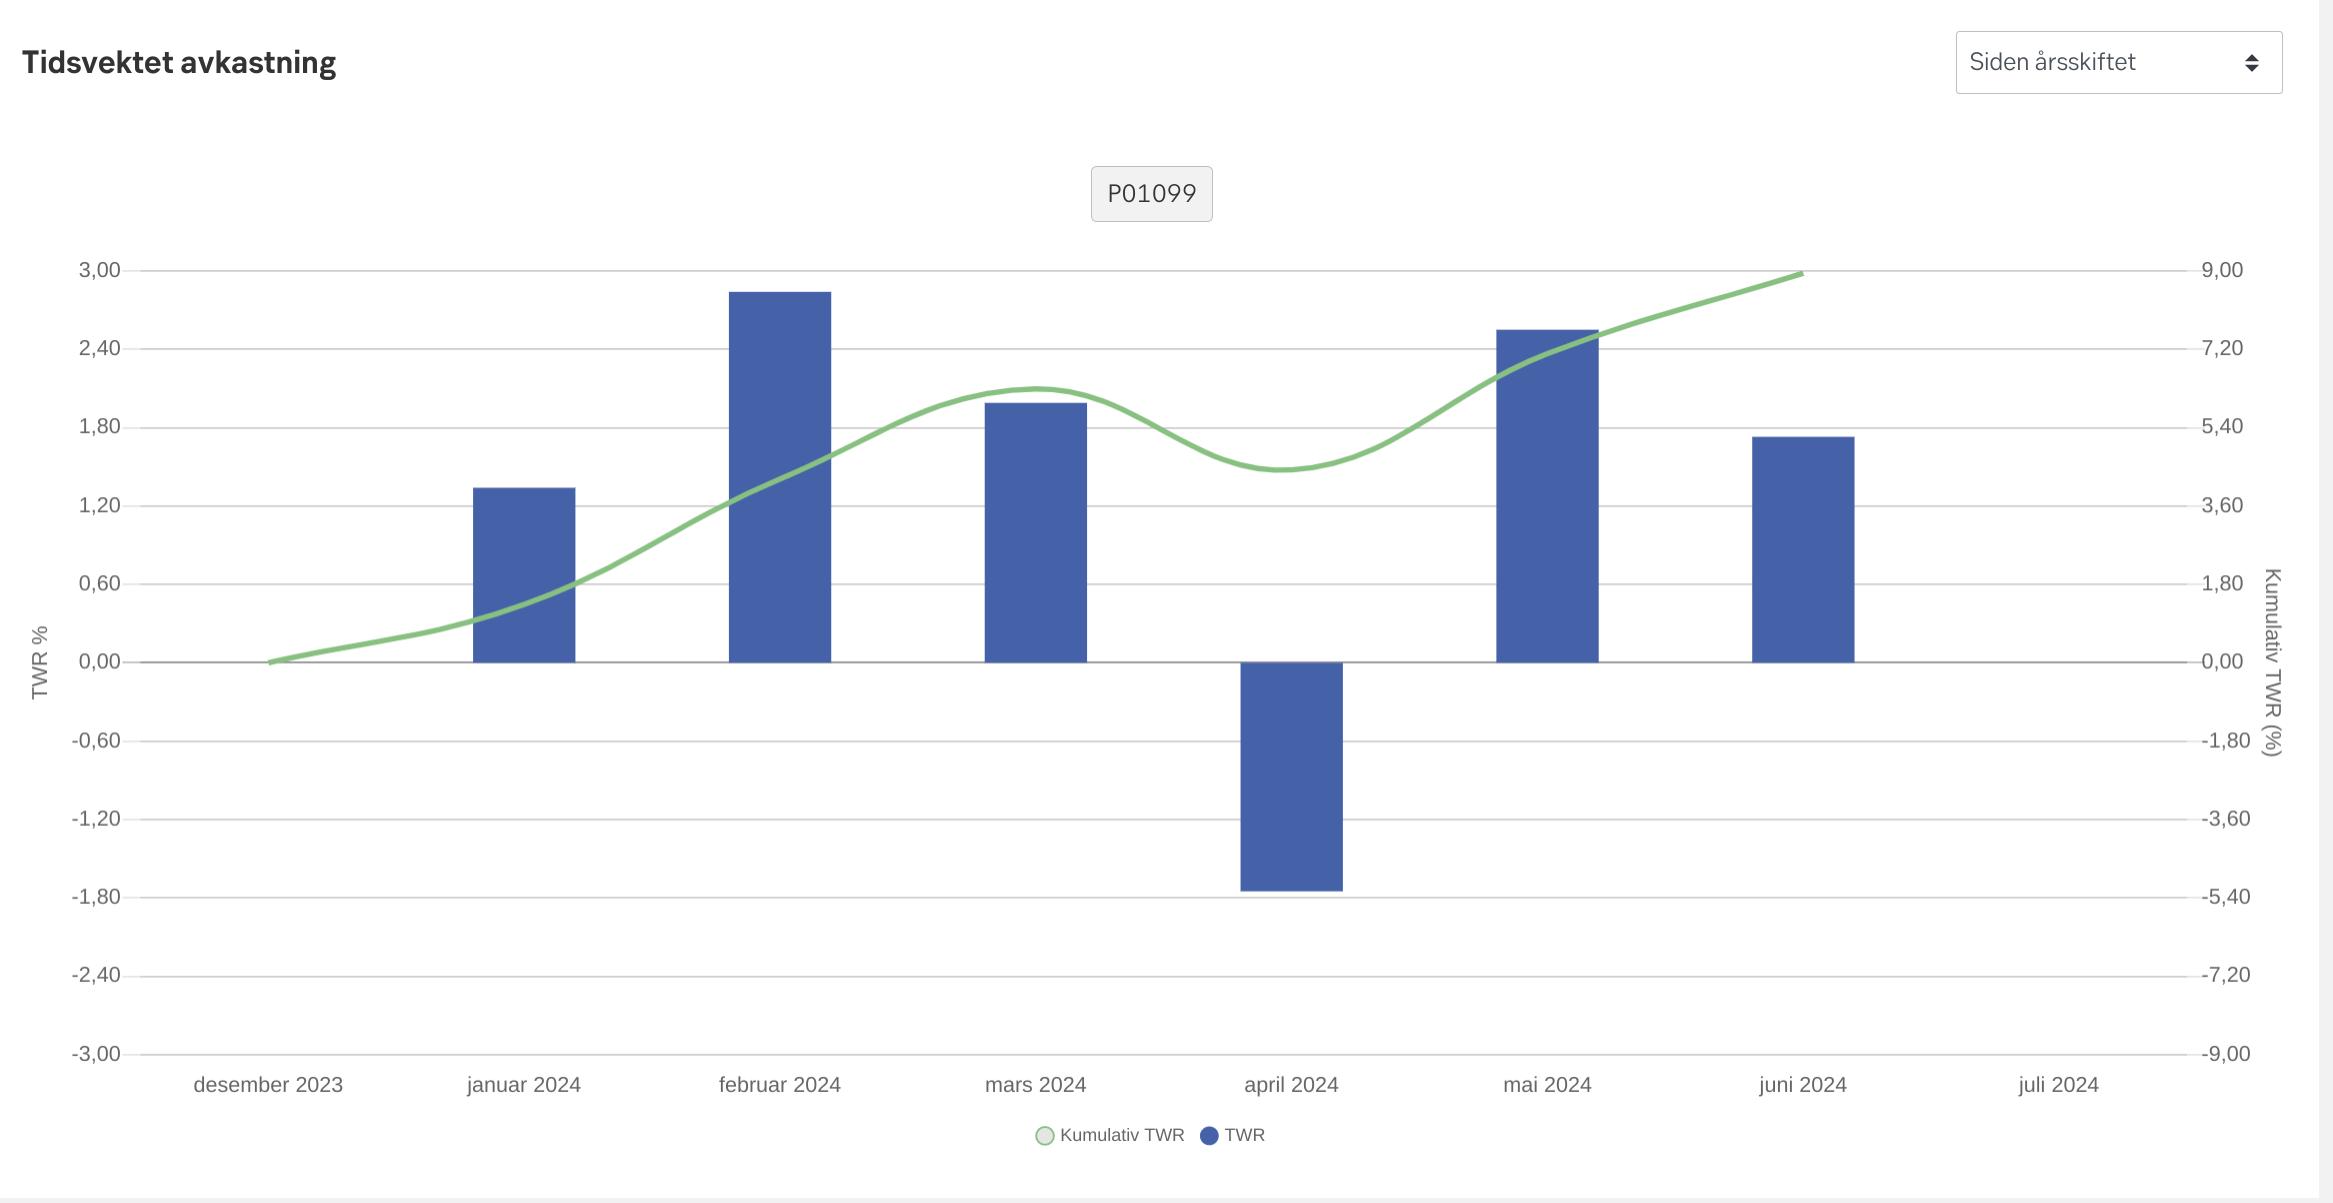
Plotting two different things with two different Y axes. I’ve never liked this style — the two things plotted here have different scales, and I just think it’s harder to make sense of. I suspect these charts became popular when you have to print a lot of charts on paper and wanted to save space, but that’s no longer usually a big concern (unless you’re publishing in a scienteriffic journal).
Also woth nothing here is that they chose pleasing max nunmbers (3 and 9) by extending the Y axes, and then they also did the same negatively… which looks nice and symmetric, but wastes a lot of resolution. And also — they chose horrible numbers between zero and max — 1.80, 3.60…!?
Anyway, I think eplot is getting close to actually being useful, so perhaps I’ll contemplate doing a release sometime soonish. But you can test it out via Microsoft Github. Please do open issues if there’s something wrong, or you have ideas, or interesting data sets that eplot gets wrong.
My comment regarding the “Plotting two different things with two different Y axes” paragraph. I think these can be useful when you want to compare the events on these different plots regarding time – e.g. when you want to see how does one variable affect the other, which one follows the other, and so on.
For example, when I as a system engineer push data into the system and measure the amout of bytes/sec sent data, and then plot the CPU load measurement into the same chart, to see how it changes in relation to the amount of sent data.
Yeah, that’s true.
I can relate to your obsession with the widget library, I was trying to build an interface for a job project of mine. But then I never got happy with the results. It seems the mainstream interface for Emacs packages is Transient nowadays.