I’m using Jetpack Stats to see what’s happenin’ on mah blogs, and it’s never been whatchamacall “great”, but it’s been OK. It’s OK. It displays all the pertinent info in one pretty compact screen: You don’t have to scroll around.
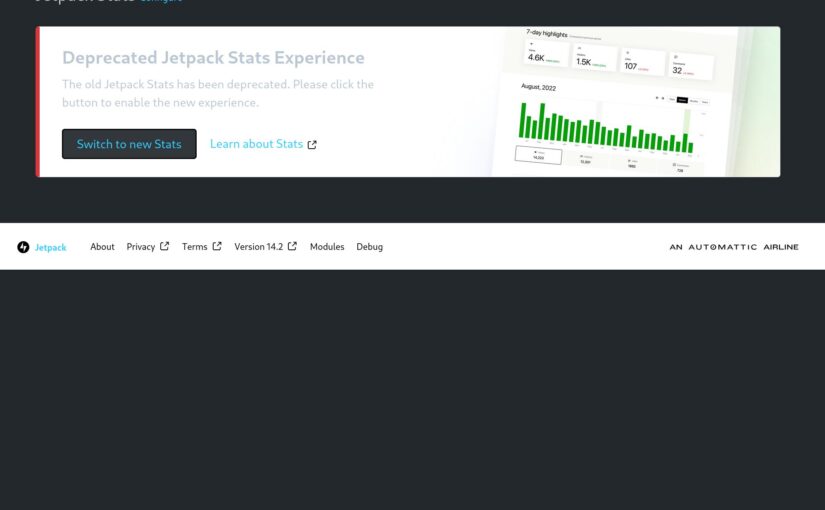
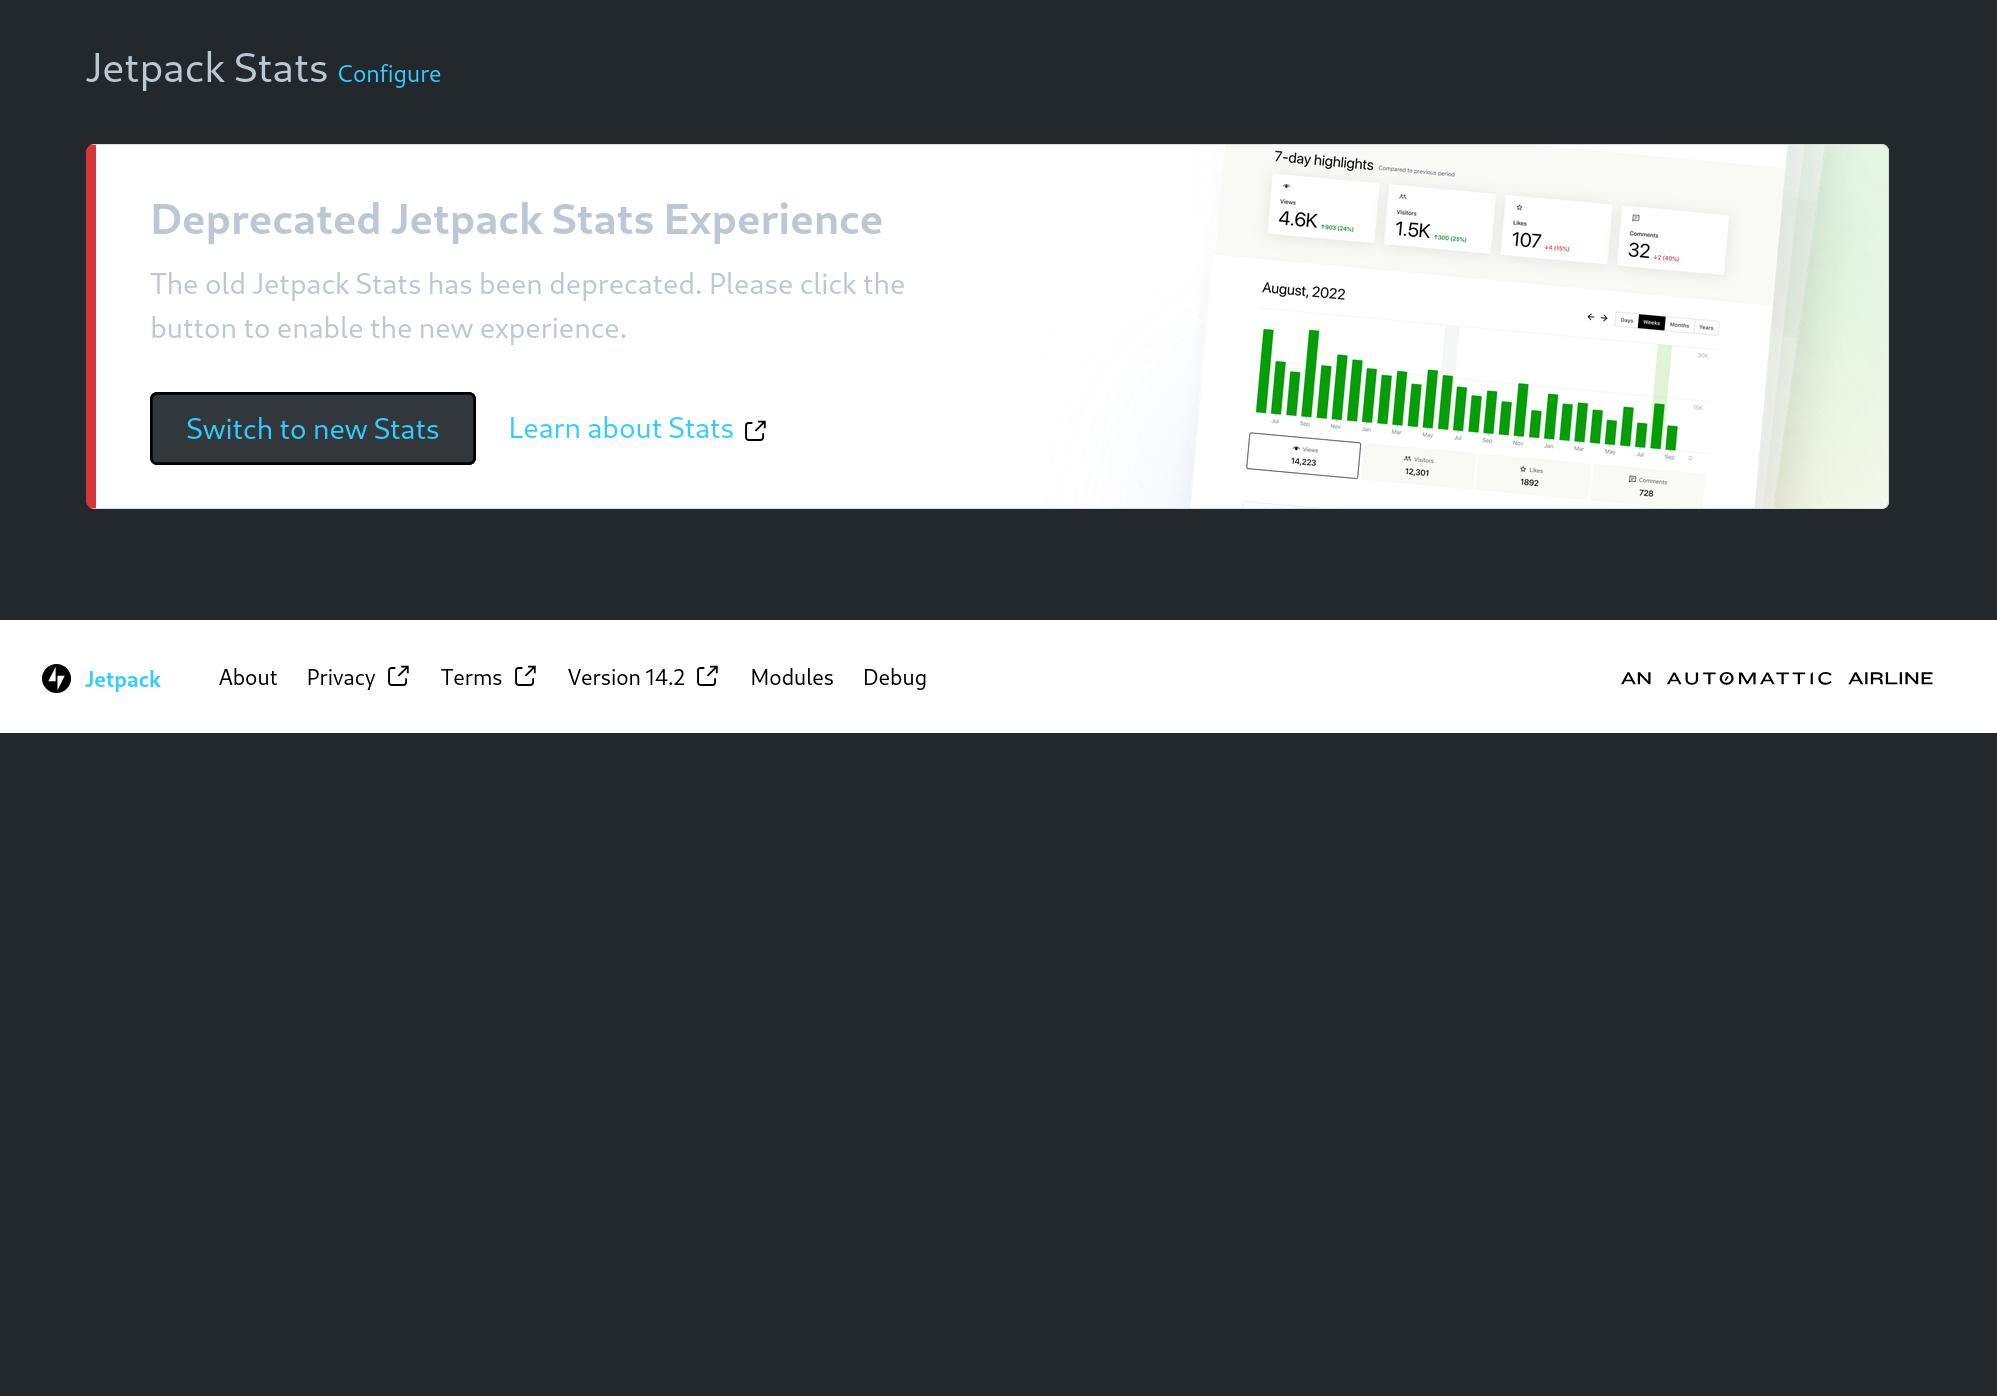
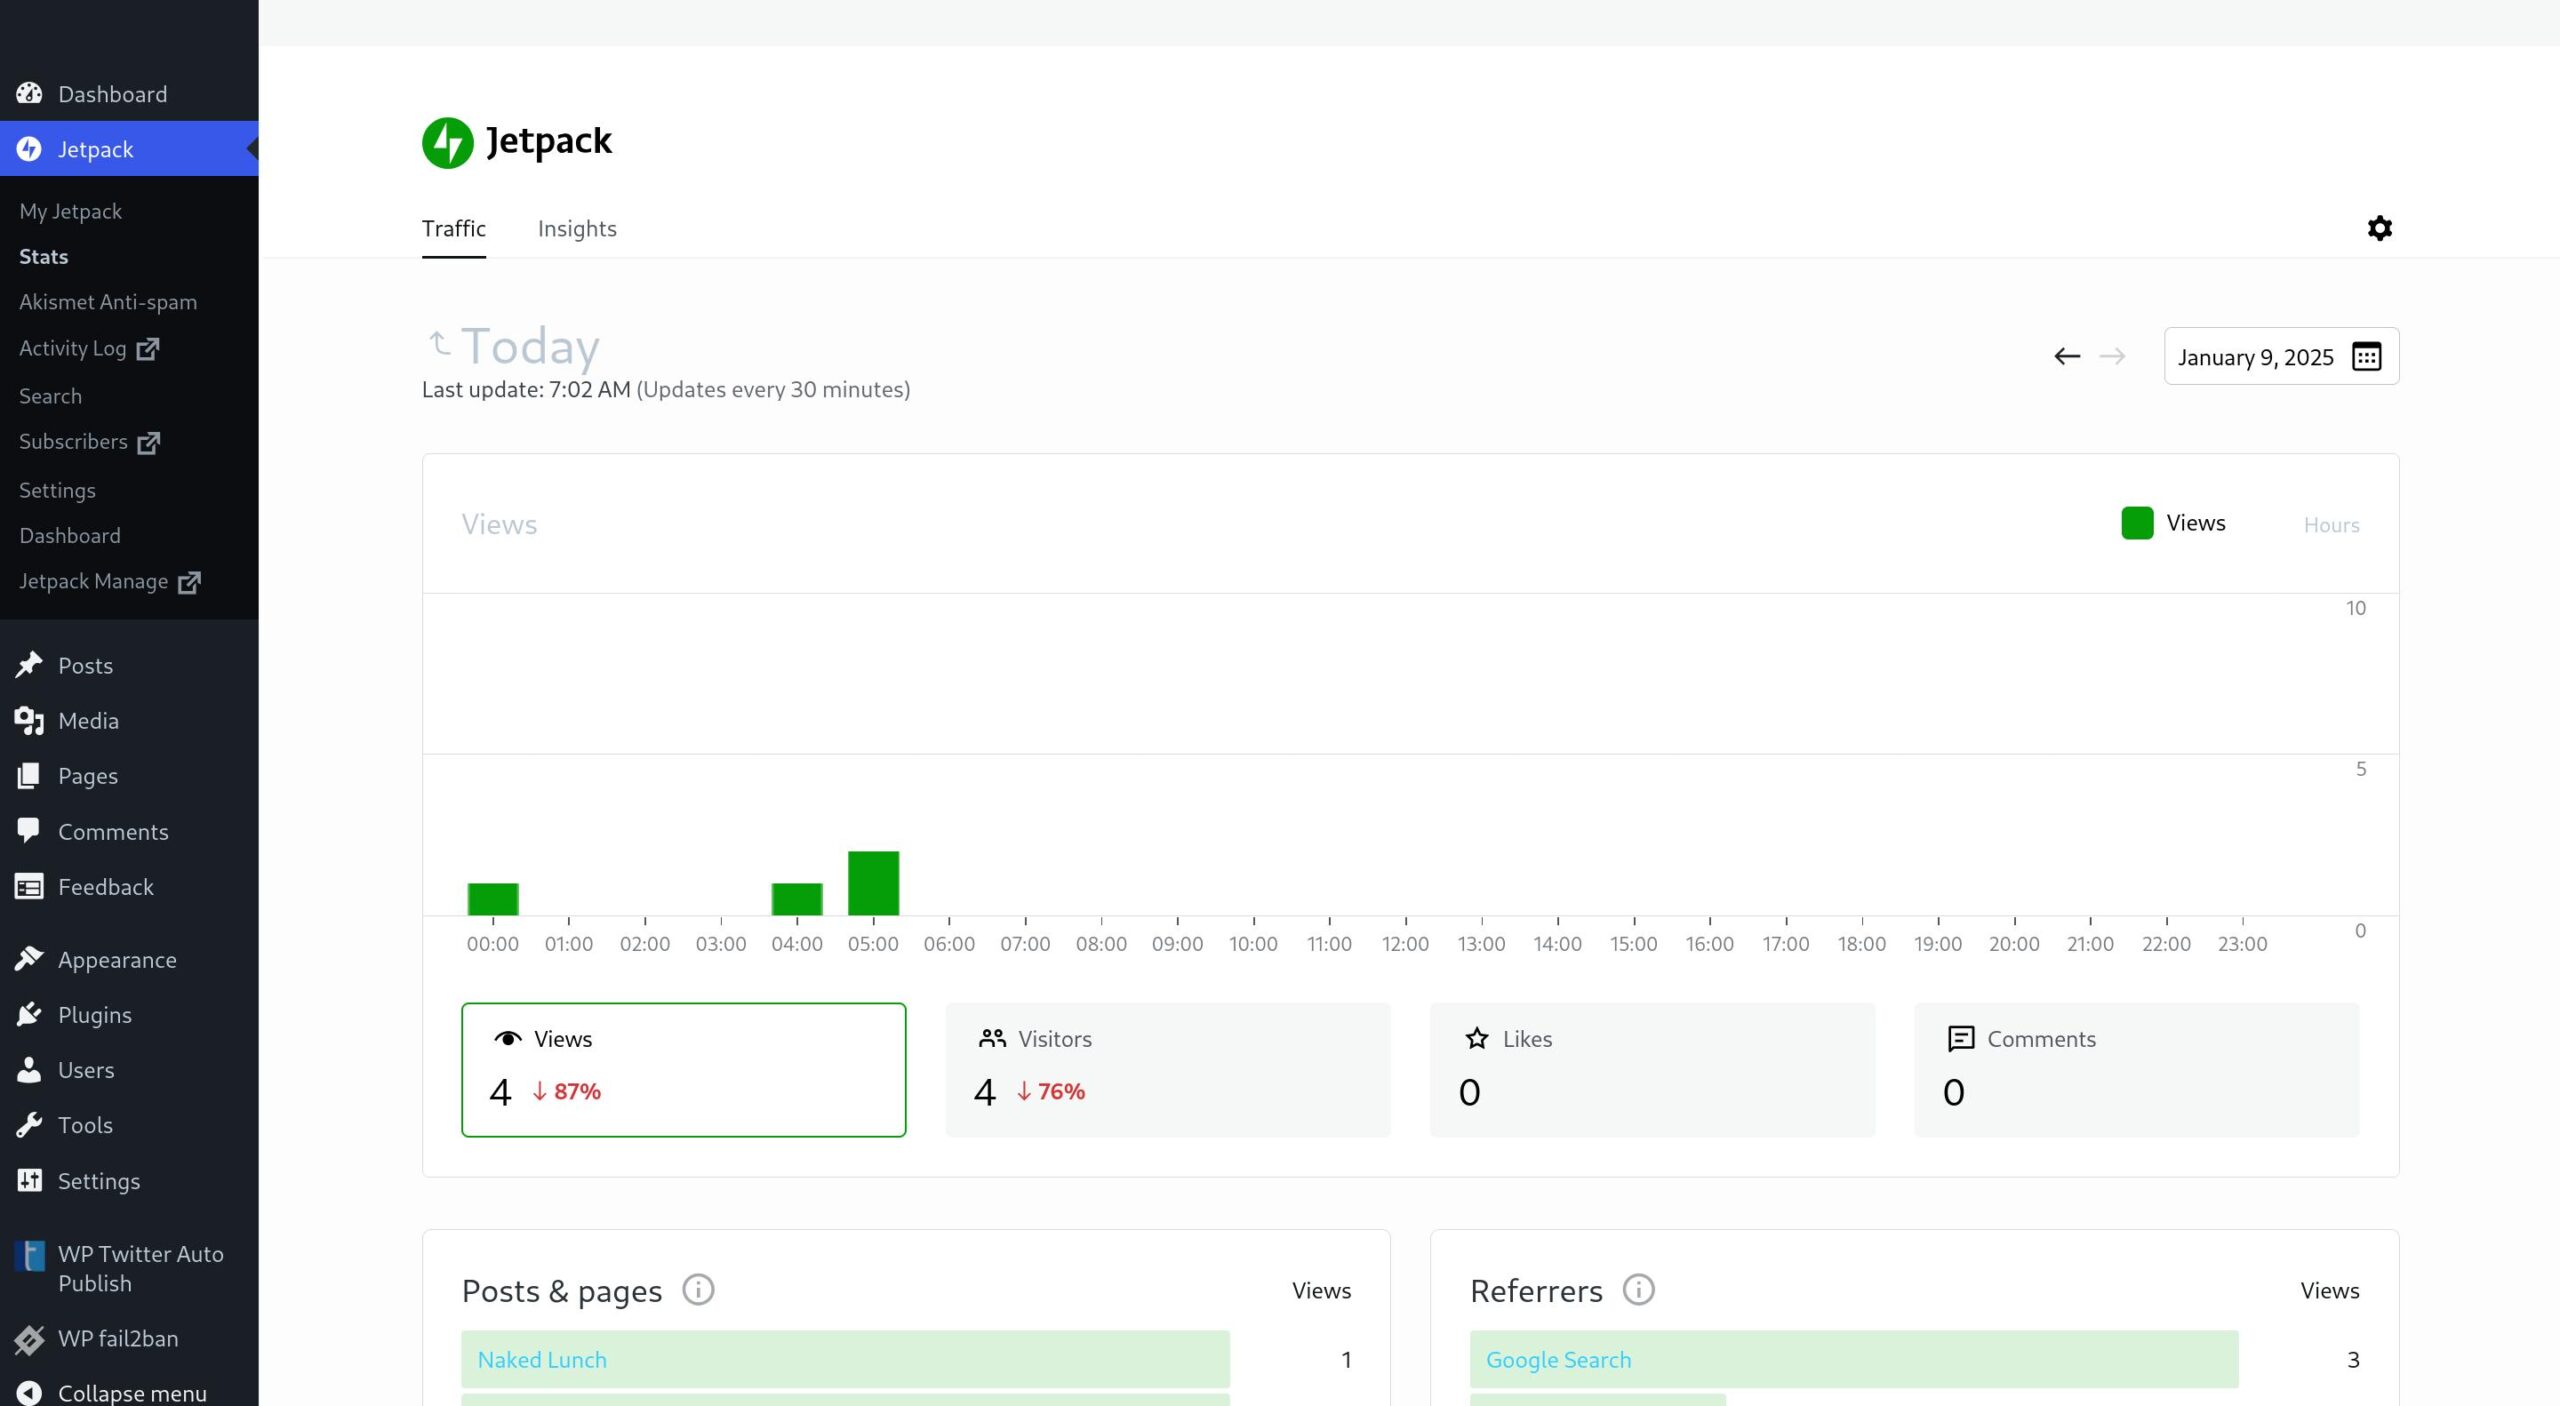
But they’ve been threatening to remove the “classic”, compact stats for years, and yesterday they apparently did, because I was faced with a page like the above.
As an example, let’s look at Moving Pictures, my auxiliary movie-watching logging blog (not really meant to be read by anybody, really).
I clicked the dreaded “switch to the new stats”, and…
Yeah, OK…
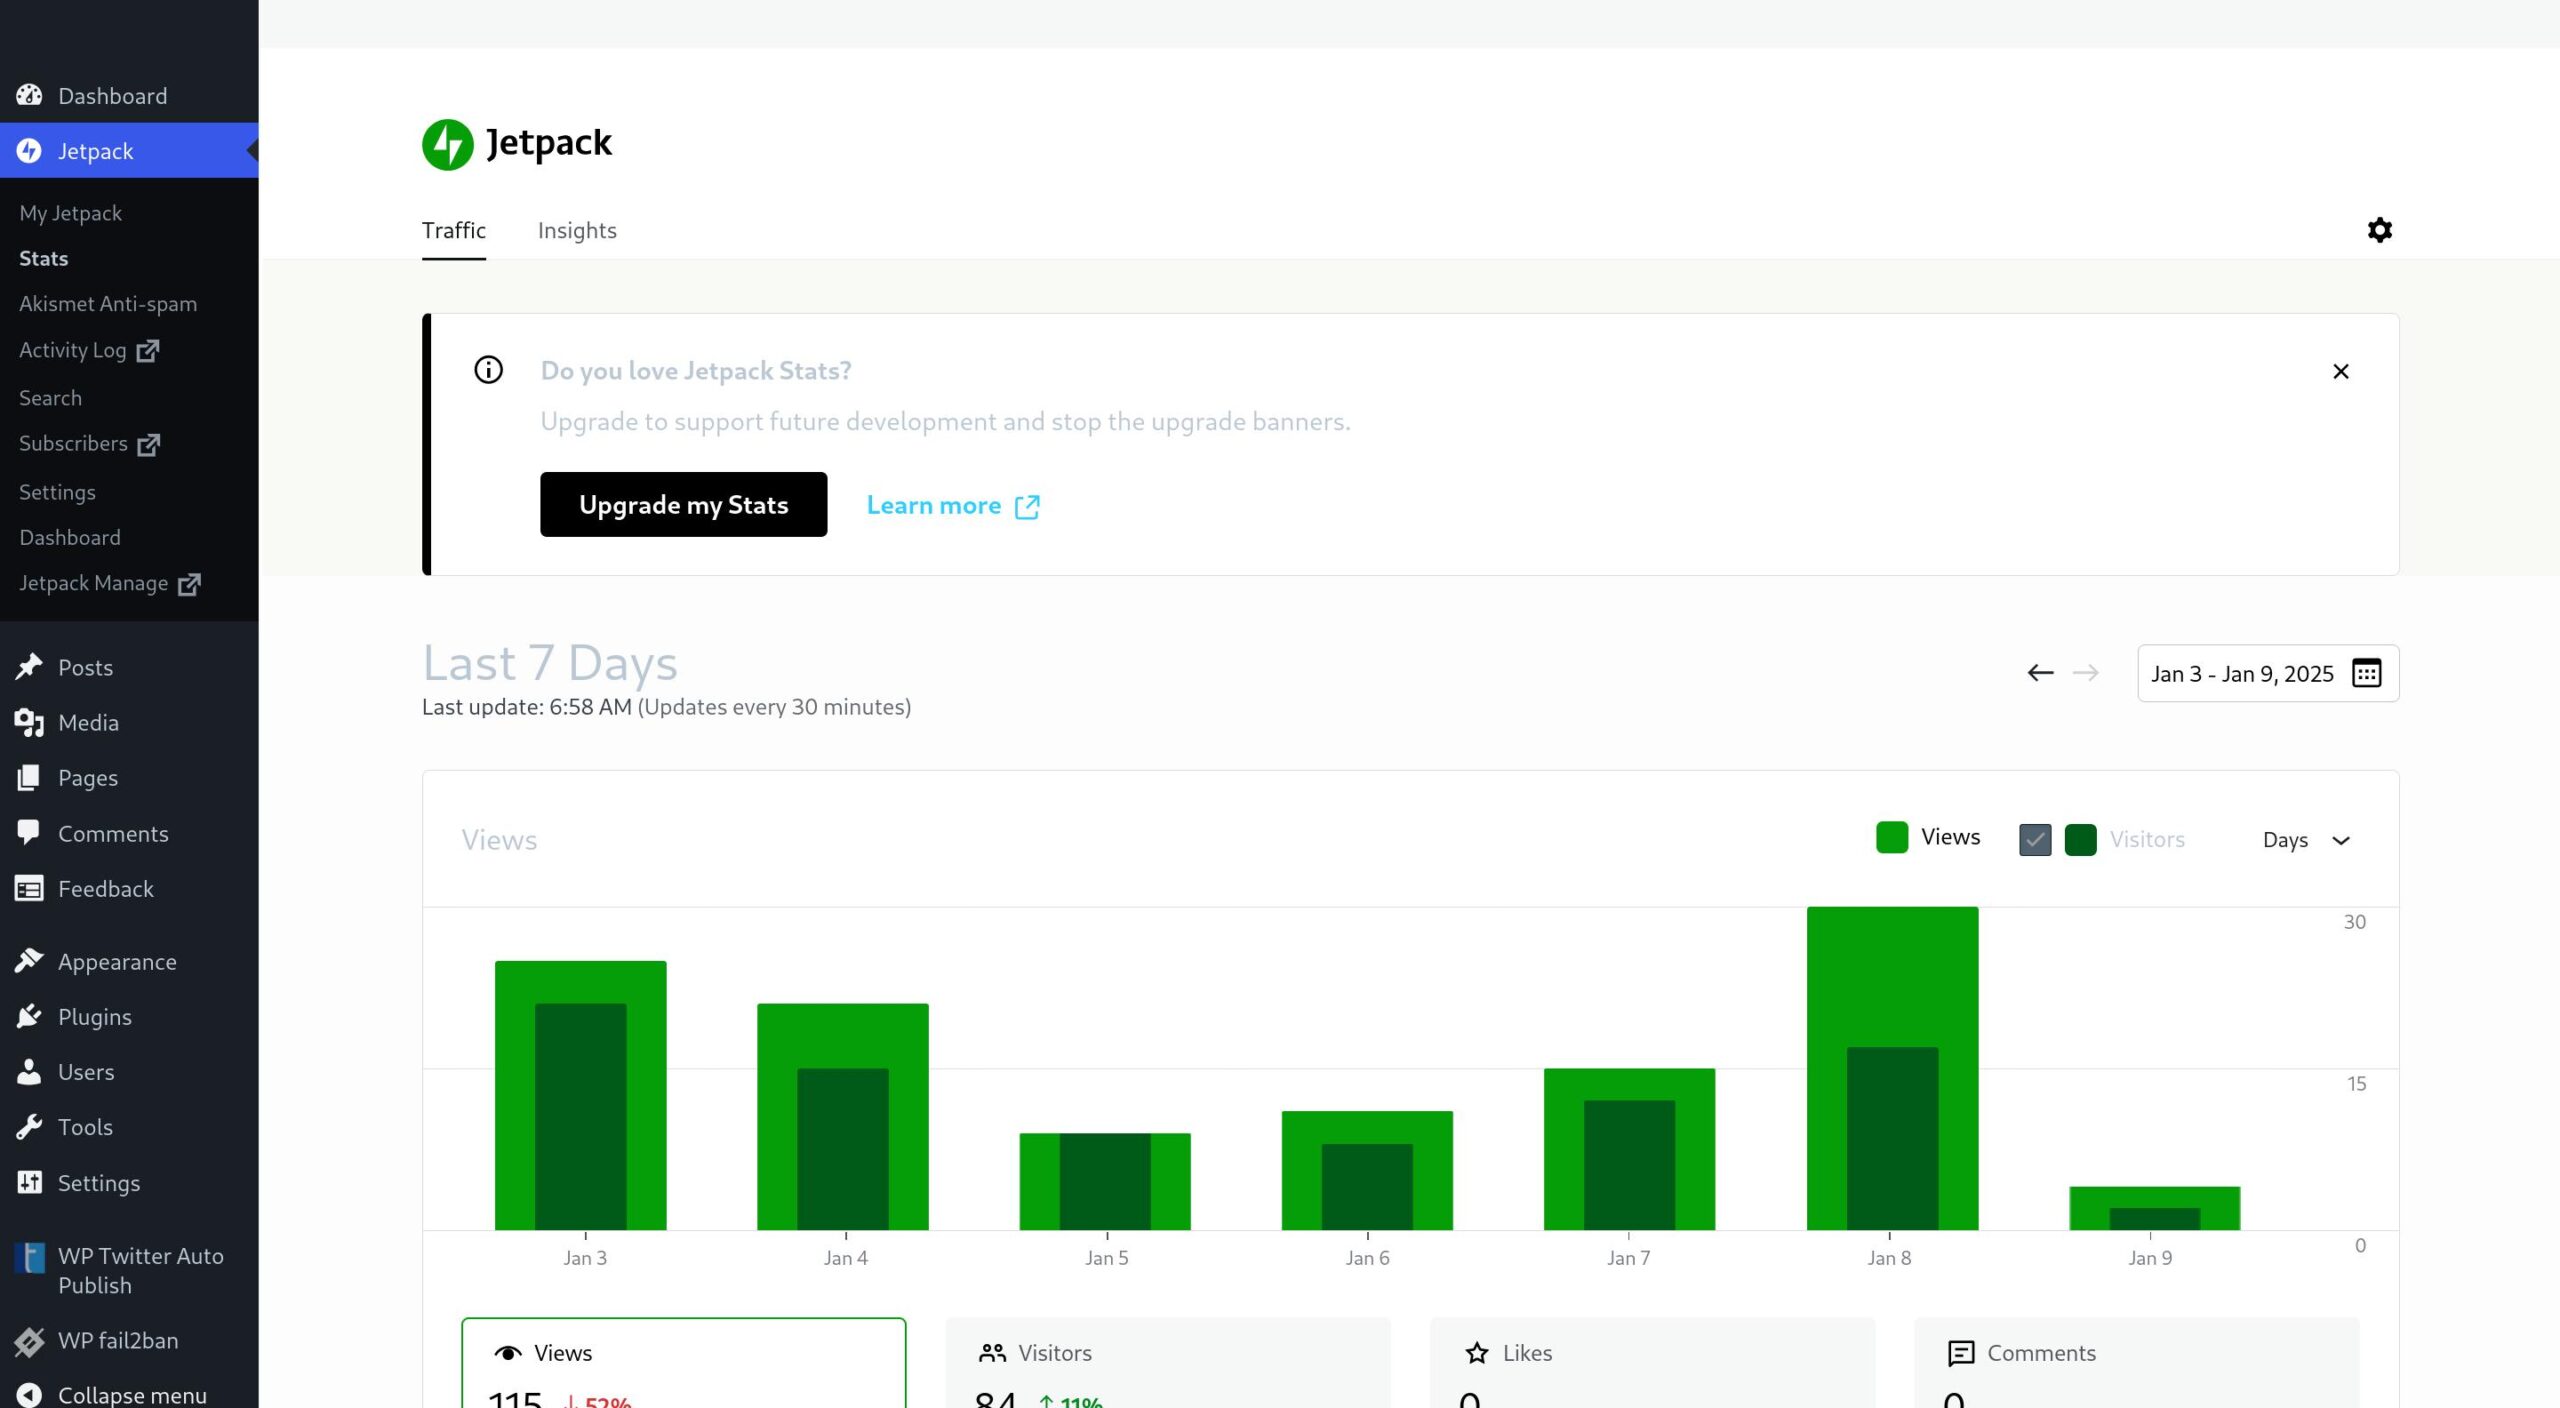
OK, “click” the ad away, and…
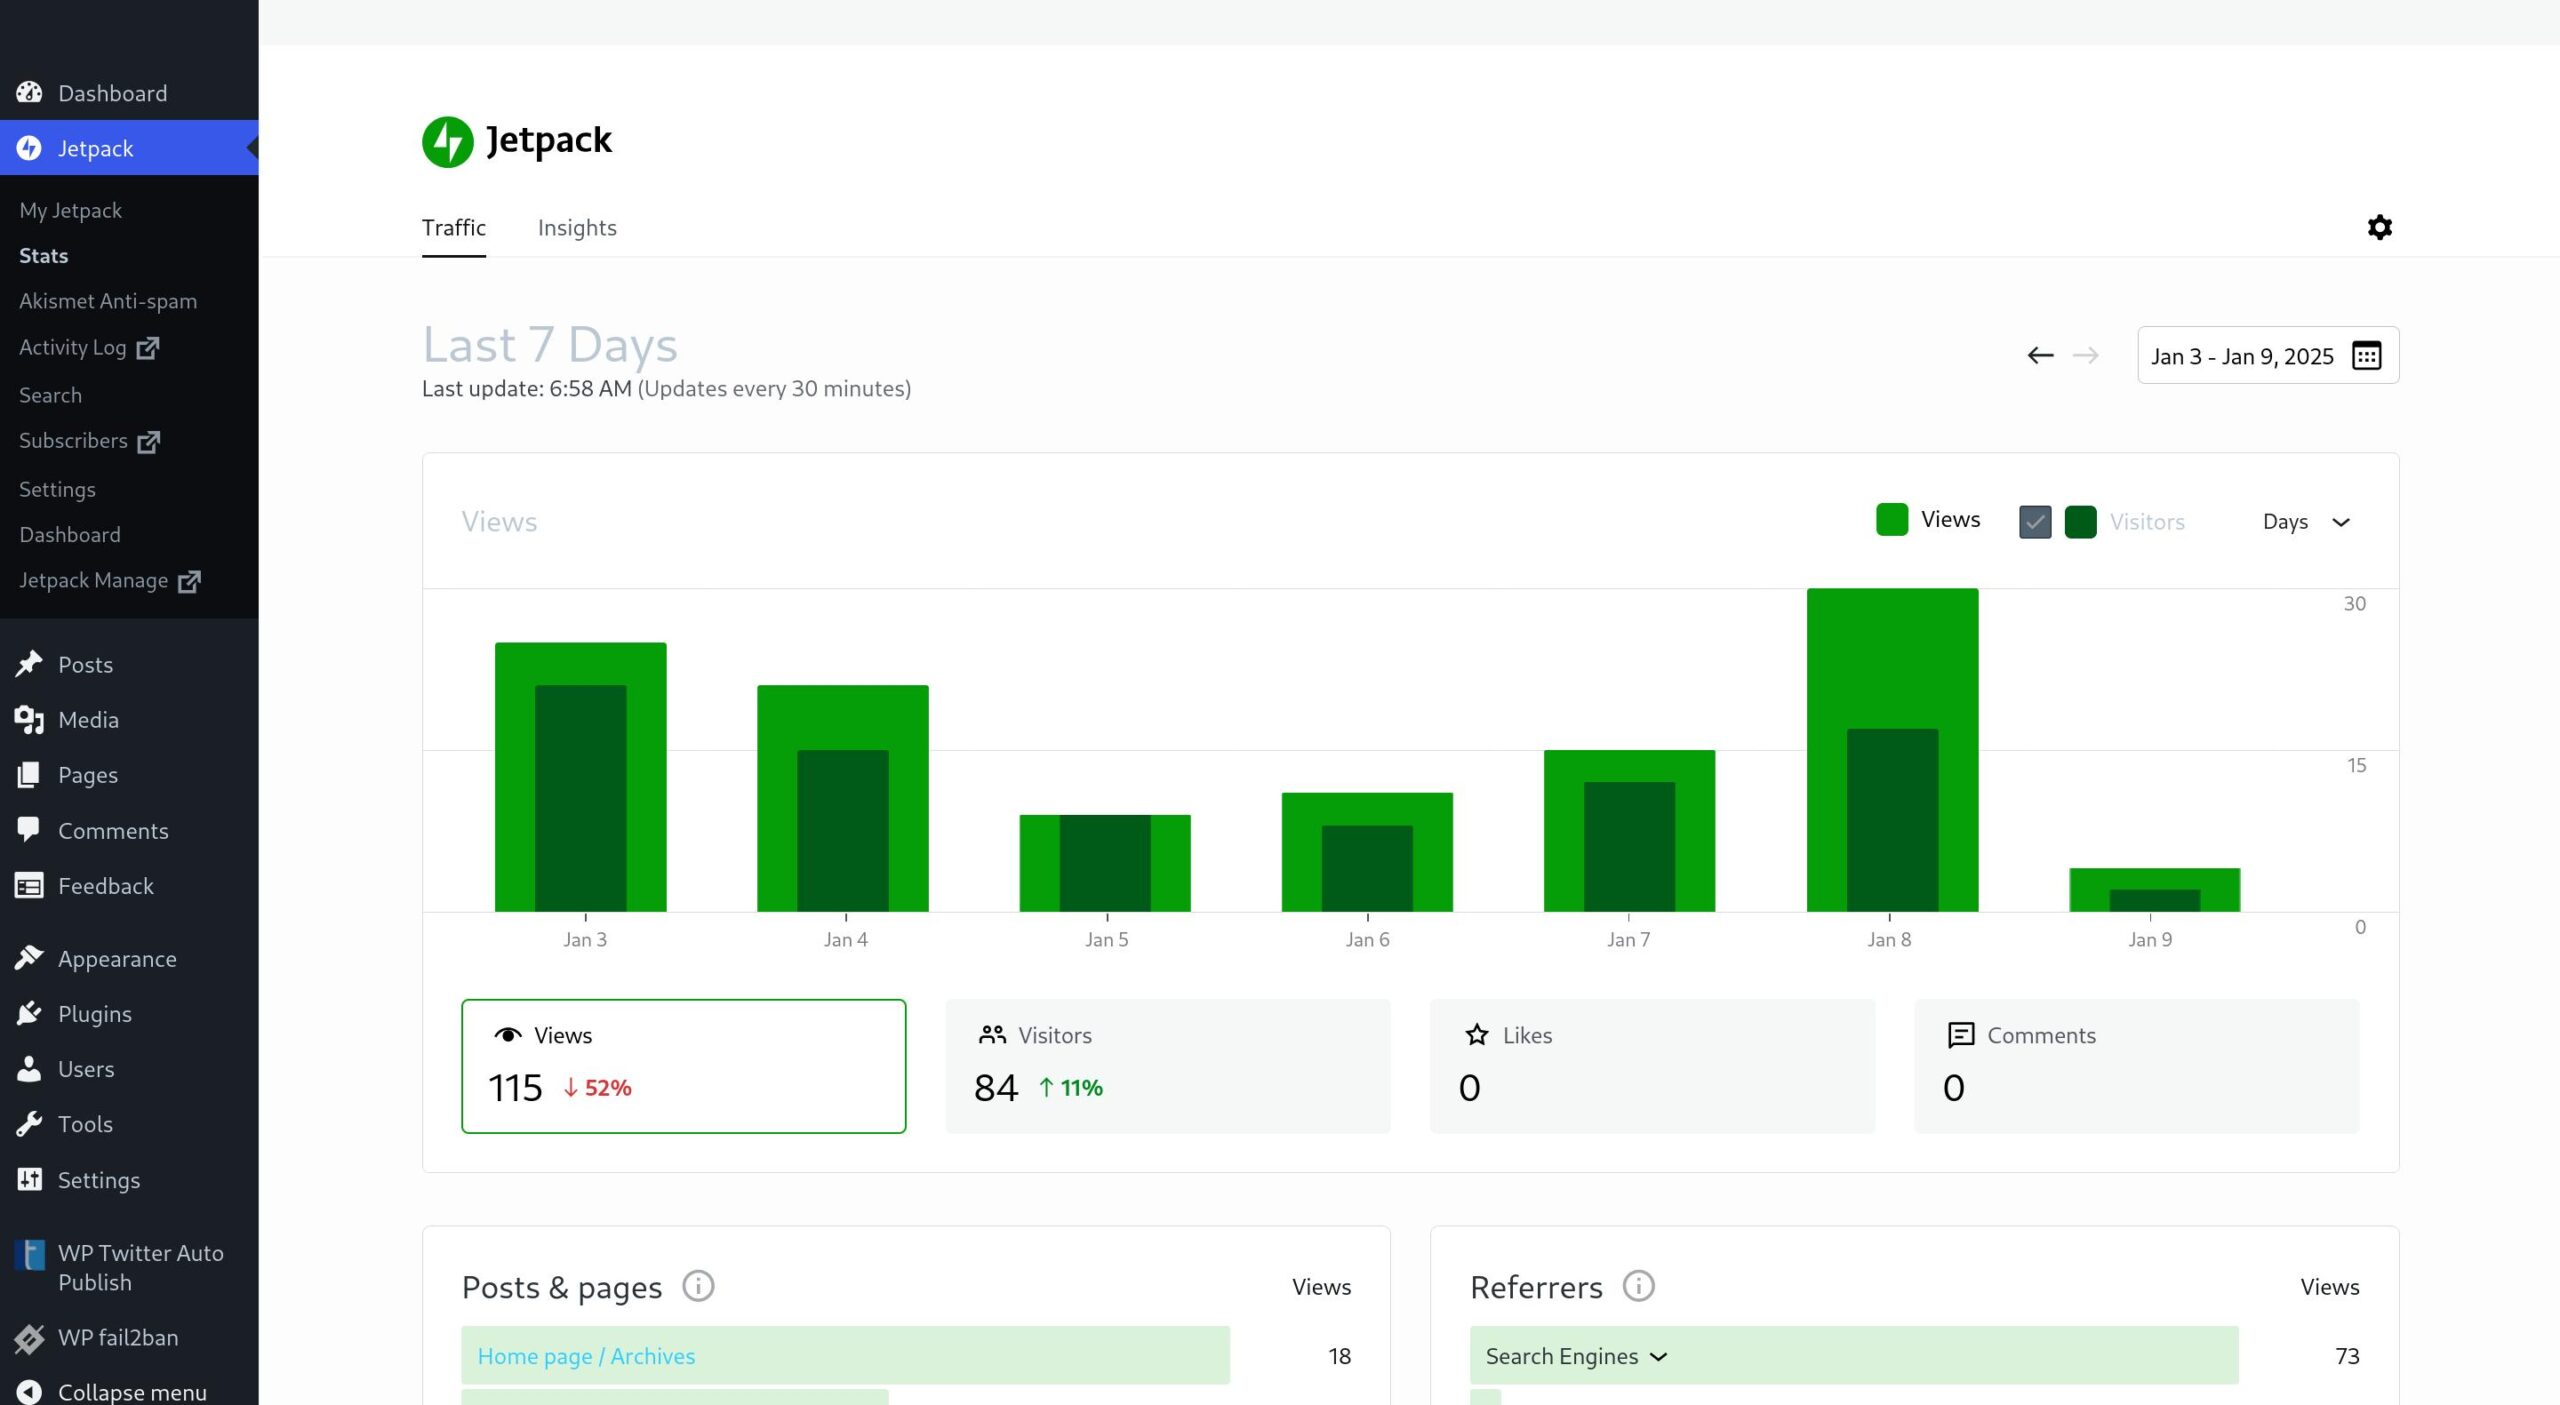
That’s the entire screen, and it shows the data for the last seven days!? OK, perhaps you can click a single day (because that’s what I’m interested in)…
*sigh*
So if I want to see today’s info, like in the old interface, I can’t see any previous days. In addition, it’s negging me: Down 87%?!? Yeah, because the day “ticked over” only a few hours earlier at this point, so any normal day will be “down” until it’s over. Why isn’t it showing me the previous 24 hours instead of the day so far, for heaven’s sake?
(I guess if you don’t have a time-series database it’s just easier and faster to just “bin” the data per day instead of having to store all the visits and do a select count(*)... thing. And WordPress very much doesn’t use a time-series database, I think.)
But let’s look at the rest of the page.
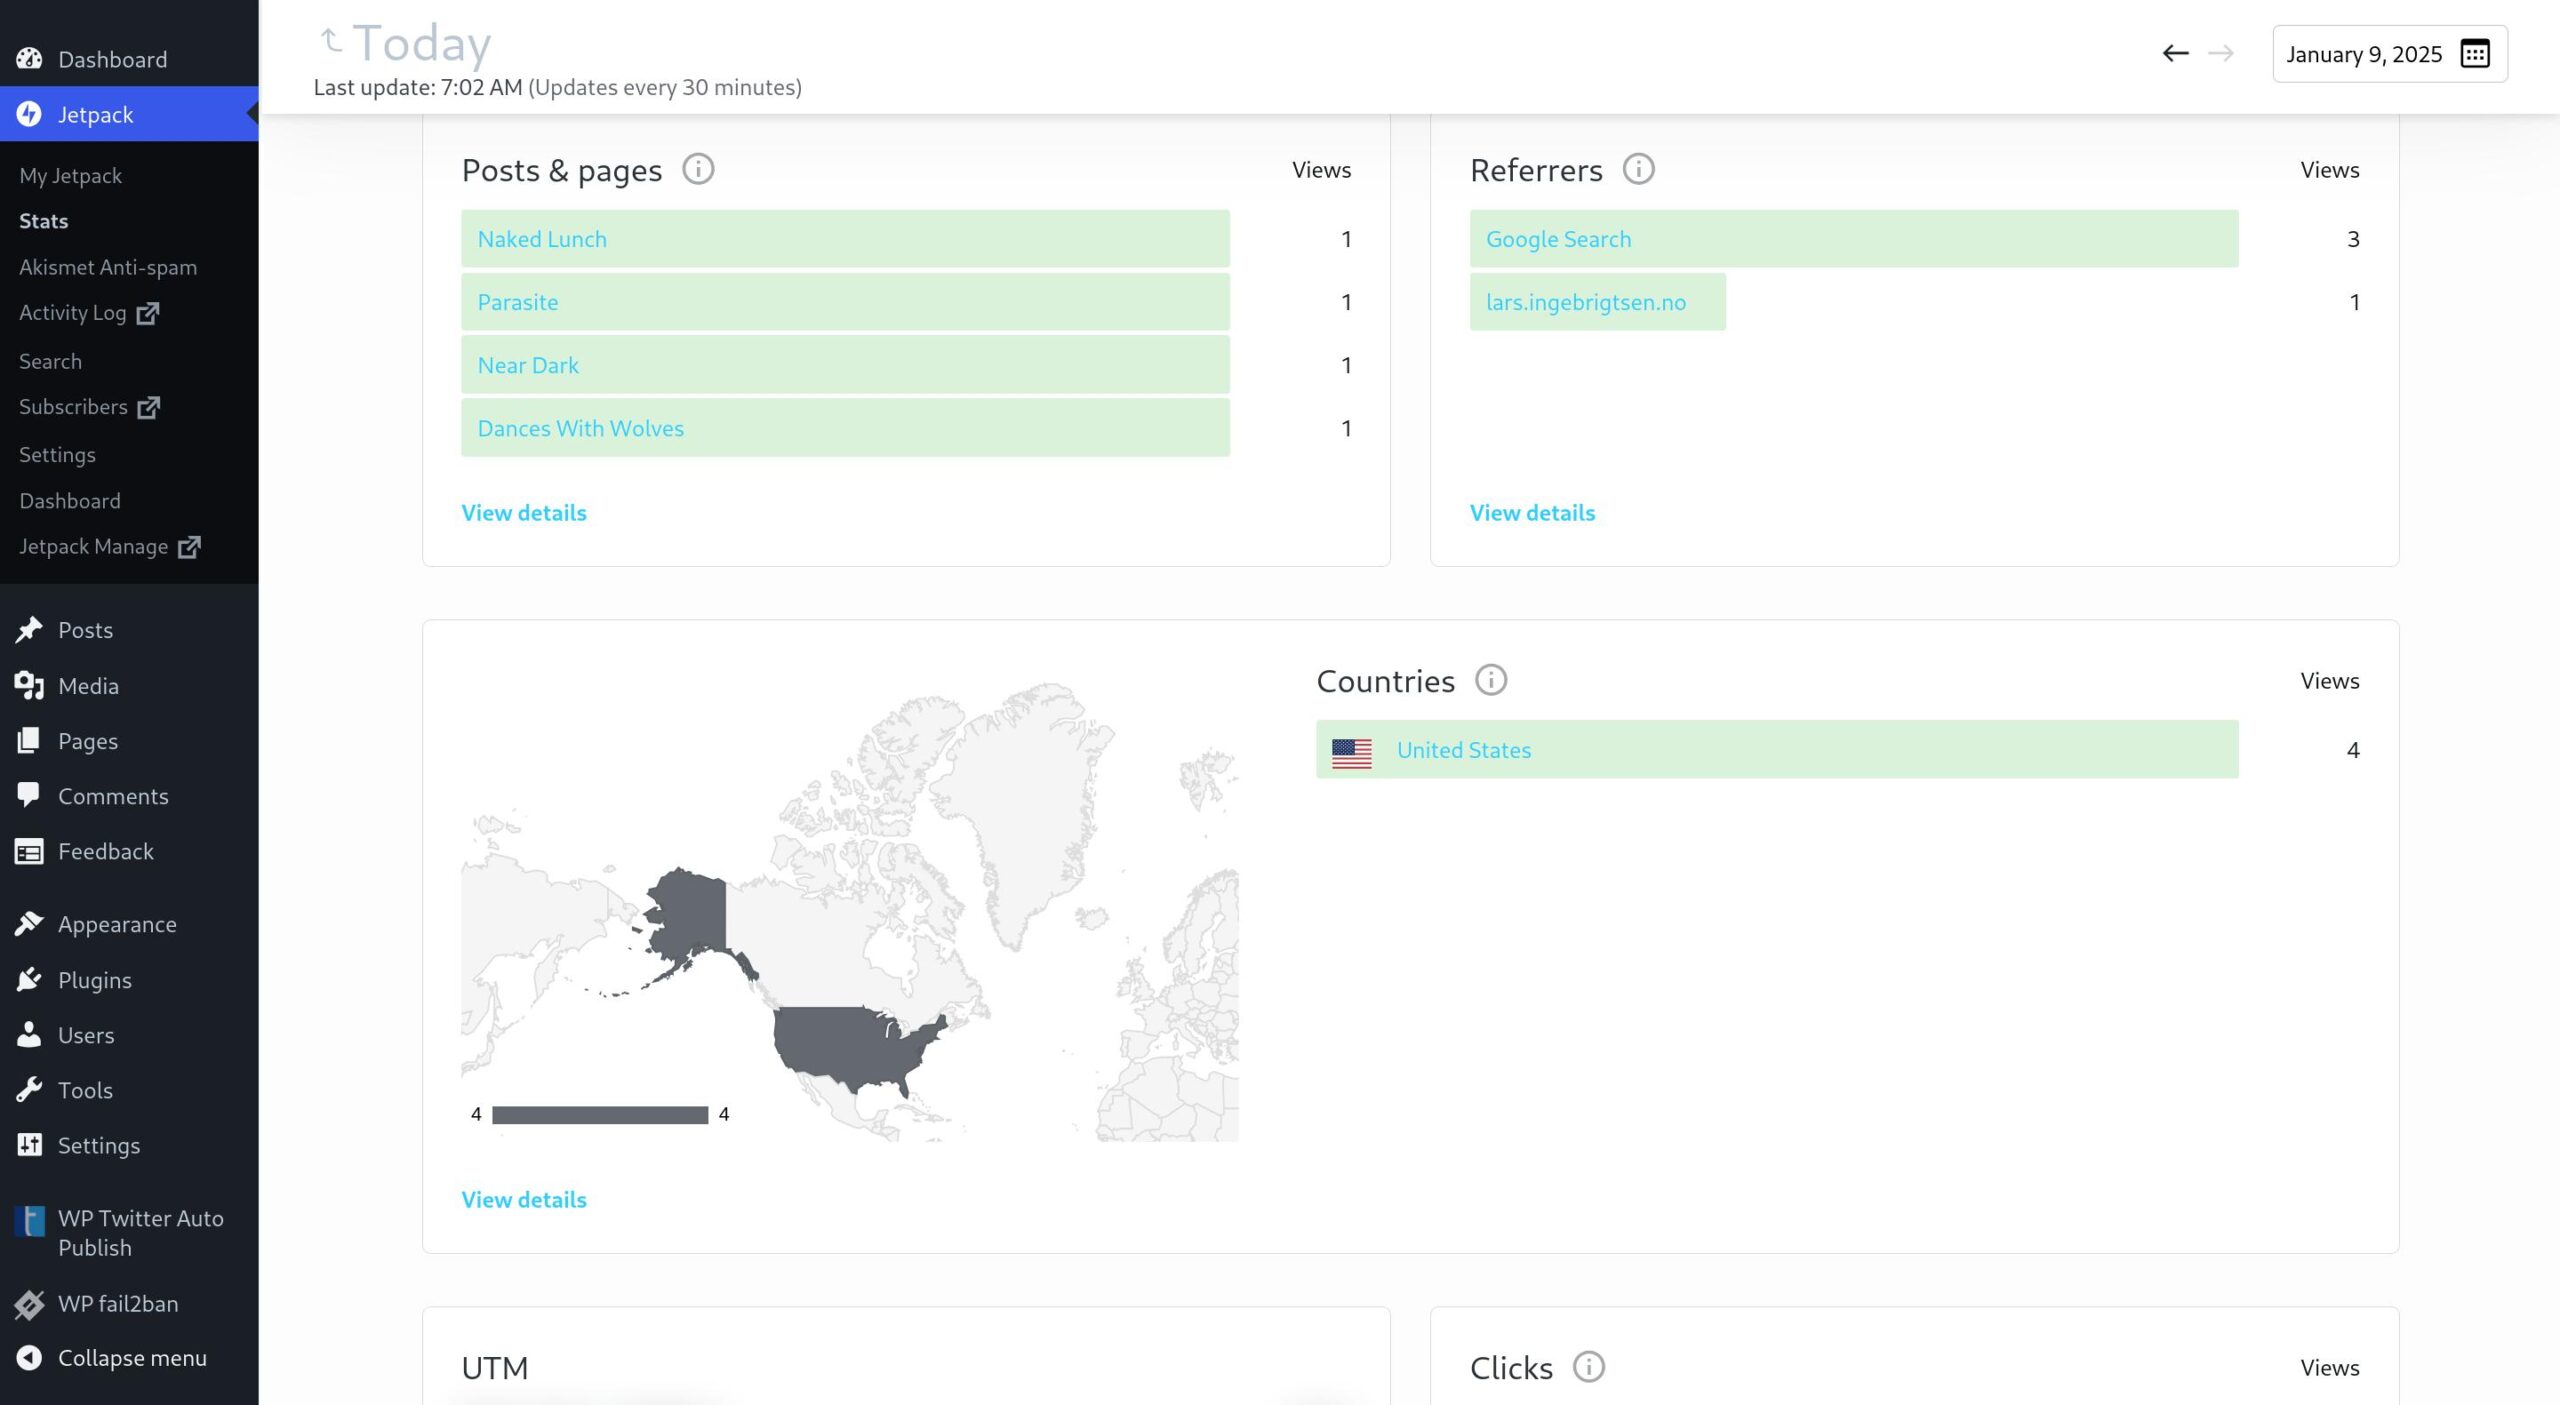
Well, that’s nice and spacious… The thing that’s interesting is really 1) the visitor tally, and 2) the referrers (useful if you have sudden explosions in visitor tallies *cough* Hackernews *cough*), and 3) clicks (to see whether something I’ve linked got a lot of traffic).
Obviously, none of that is really of interest here, since that site has no visitors, really, but bear with me.
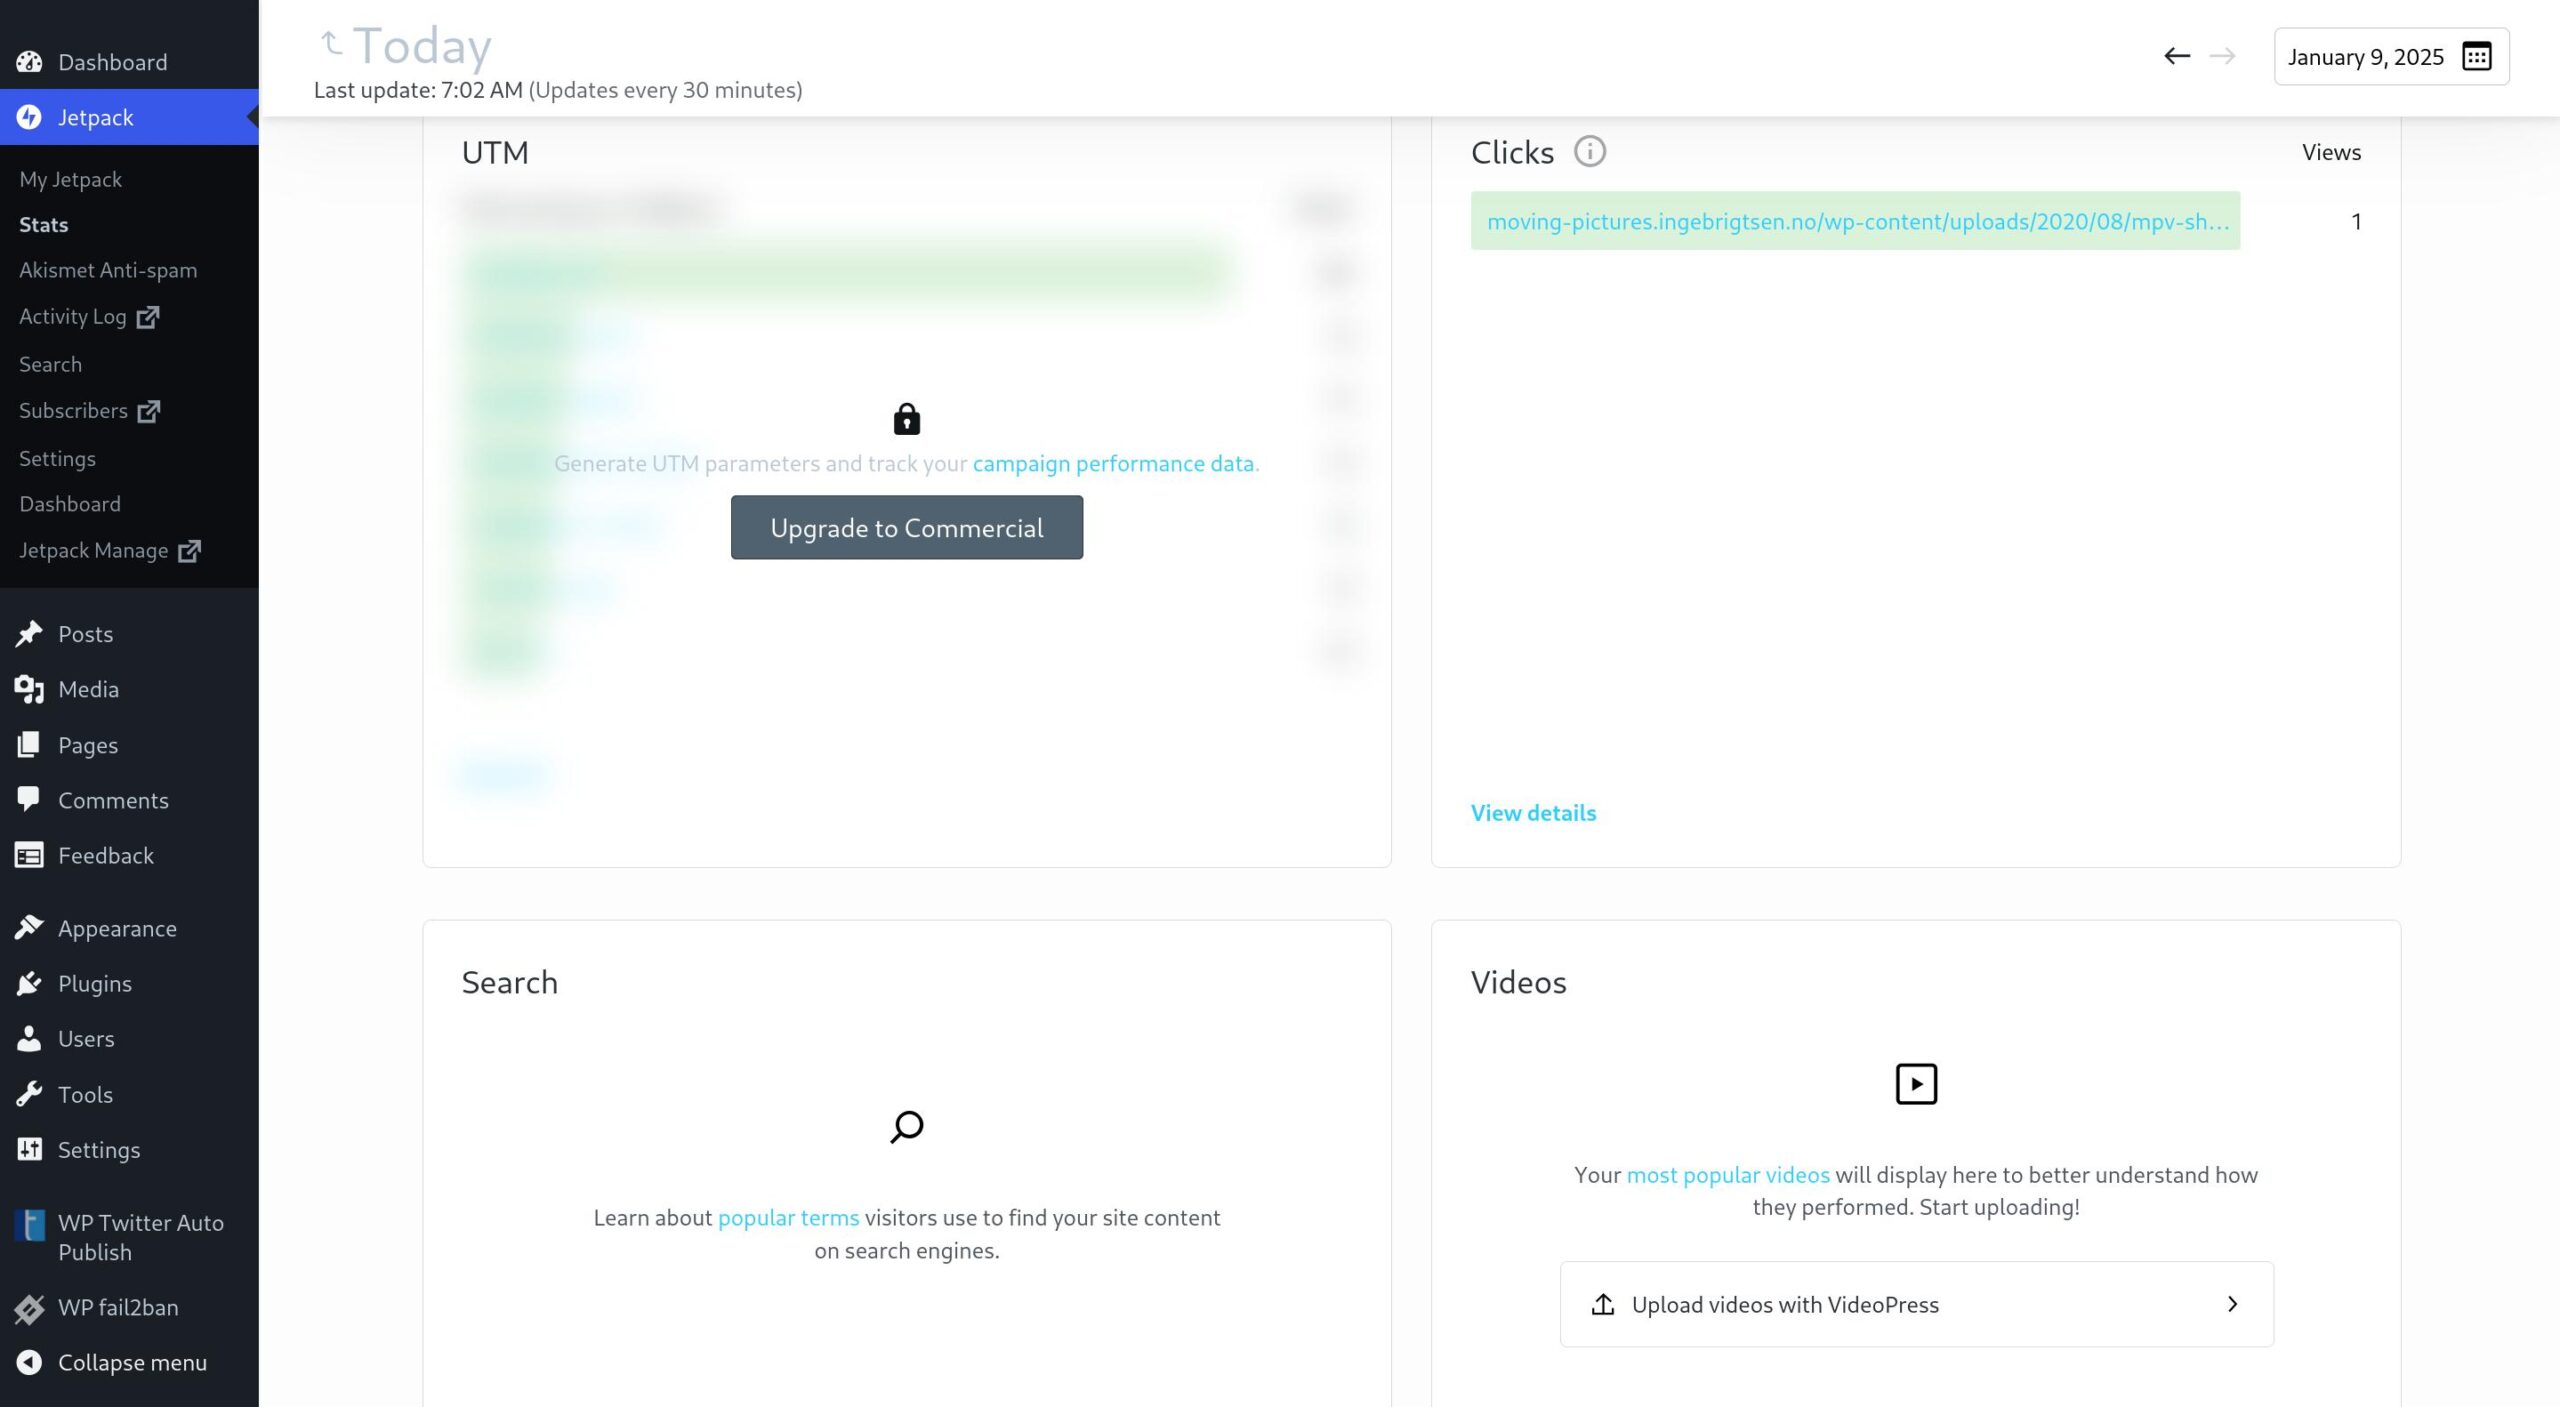
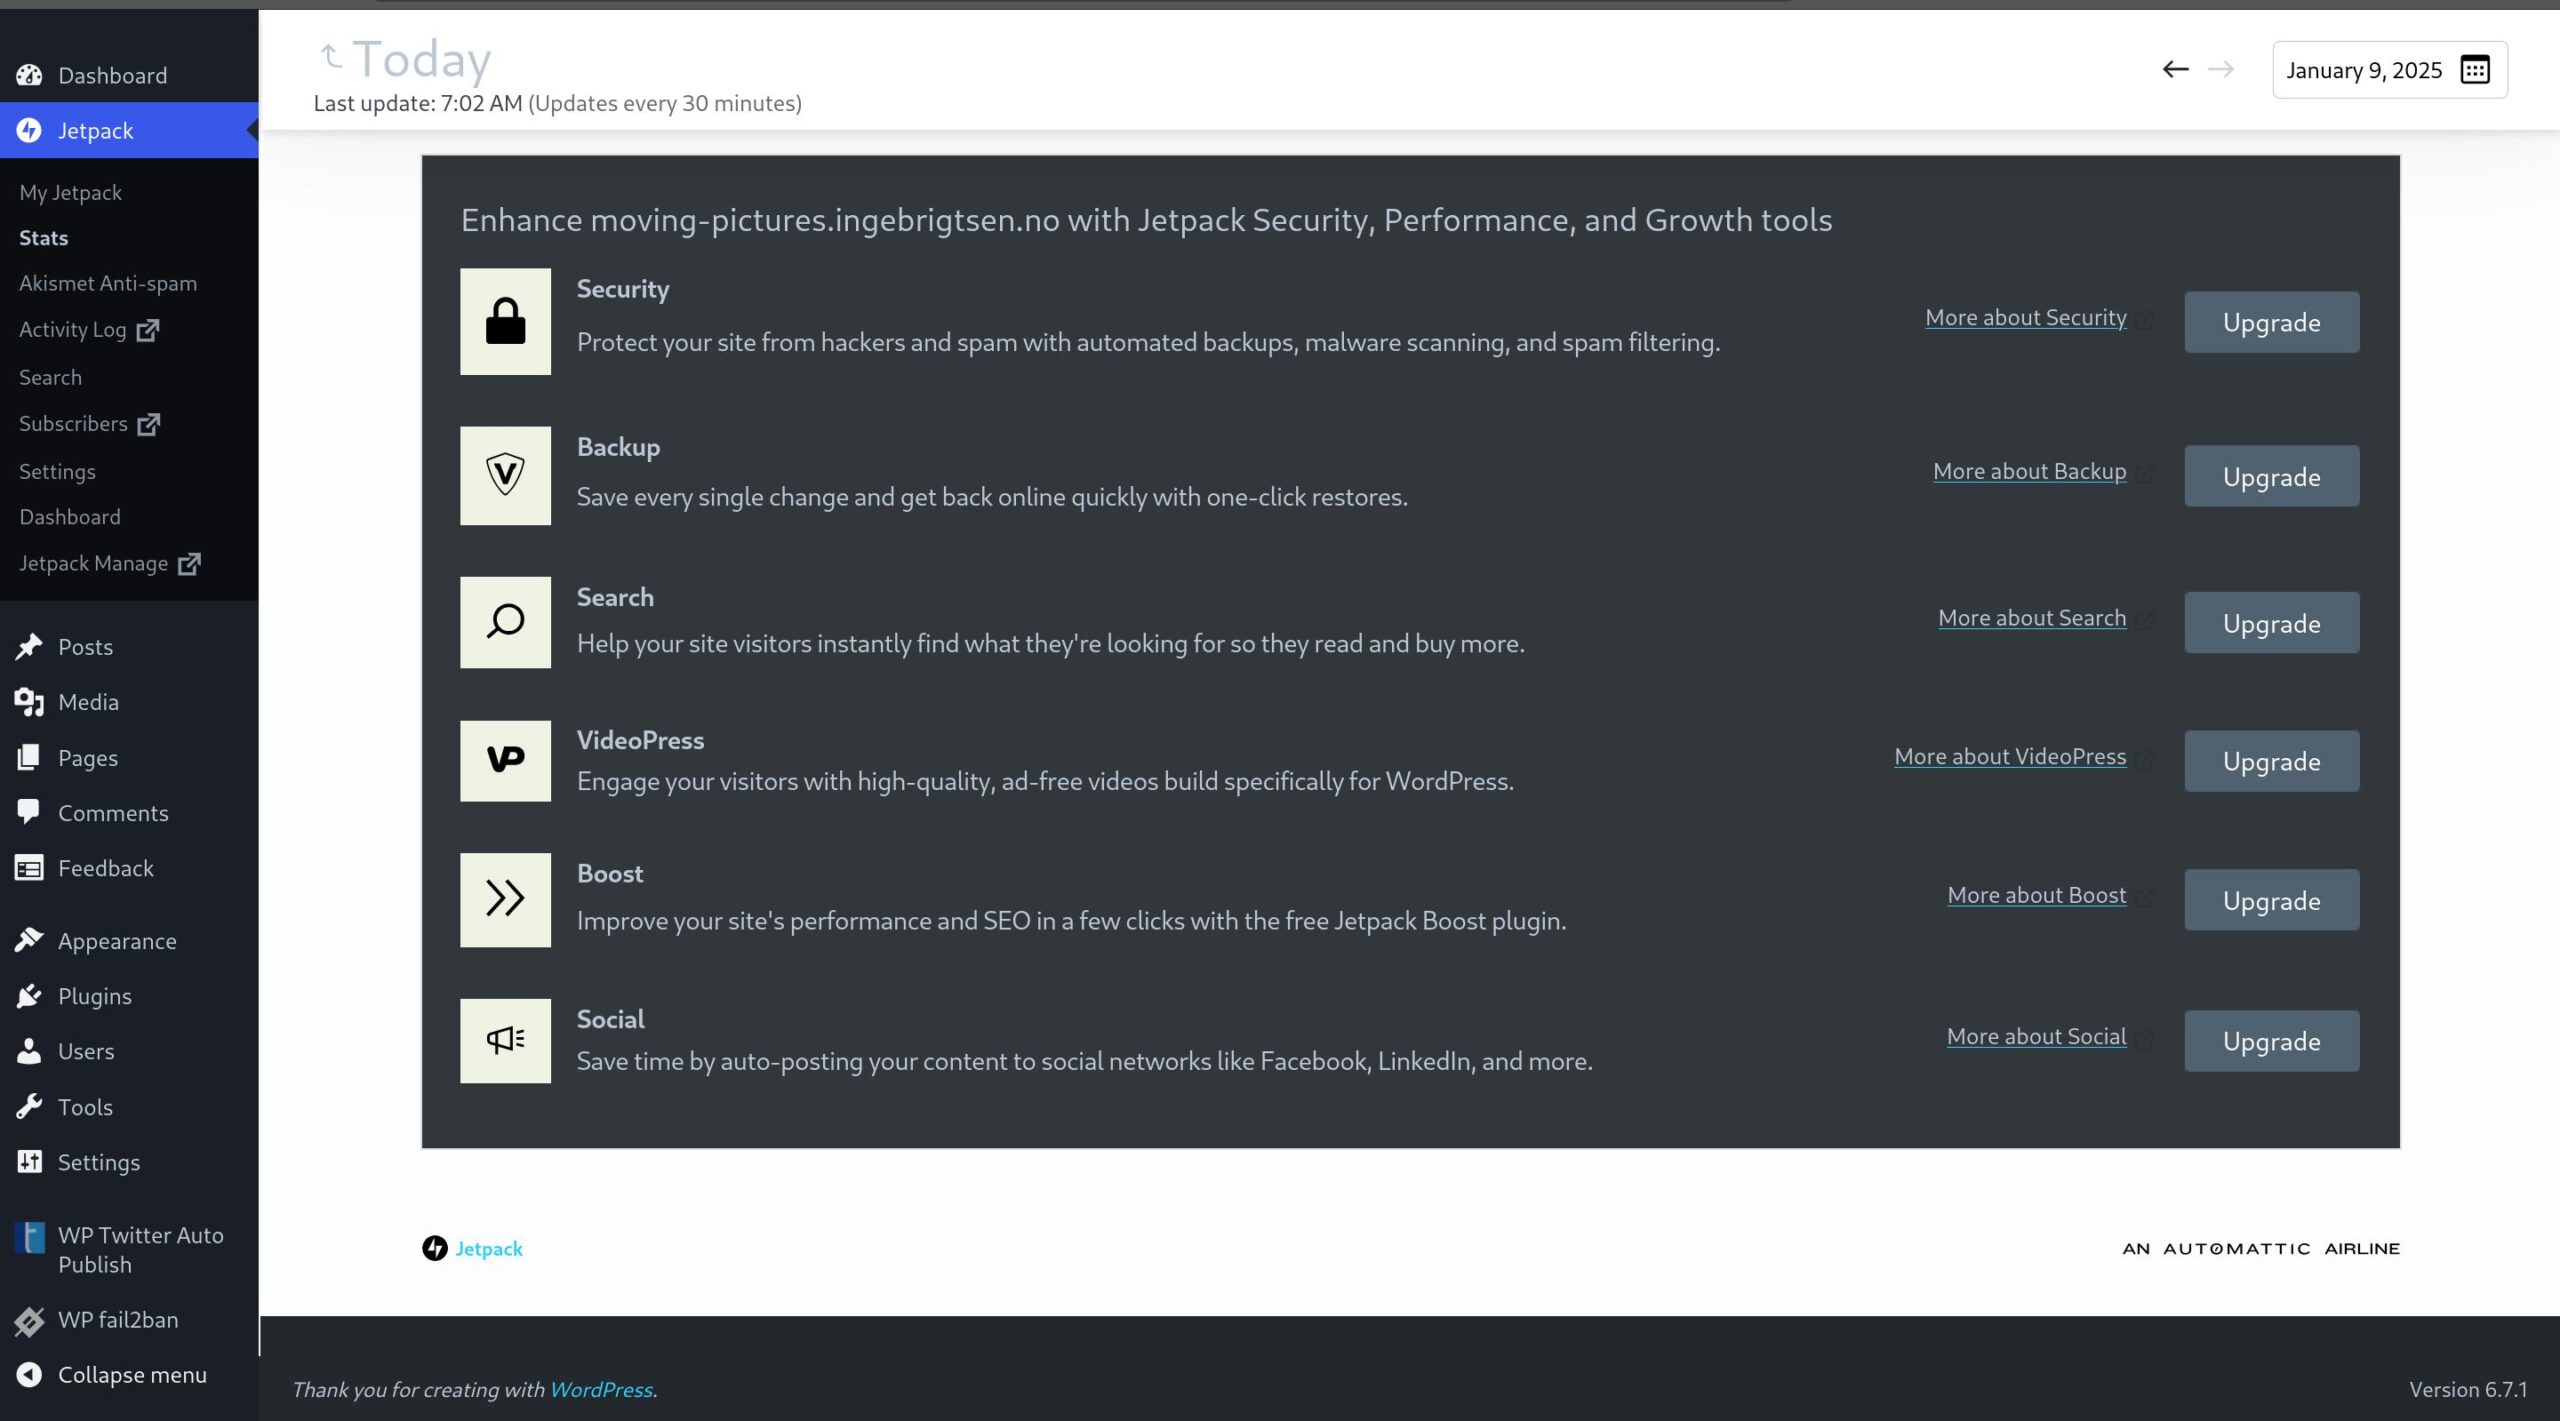
So scrolling down, the next page has an upsell block, and then the clicks. The “Search” box is never useful, since (virtually) every search engine wisely censors search terms, and there are no videos to track.
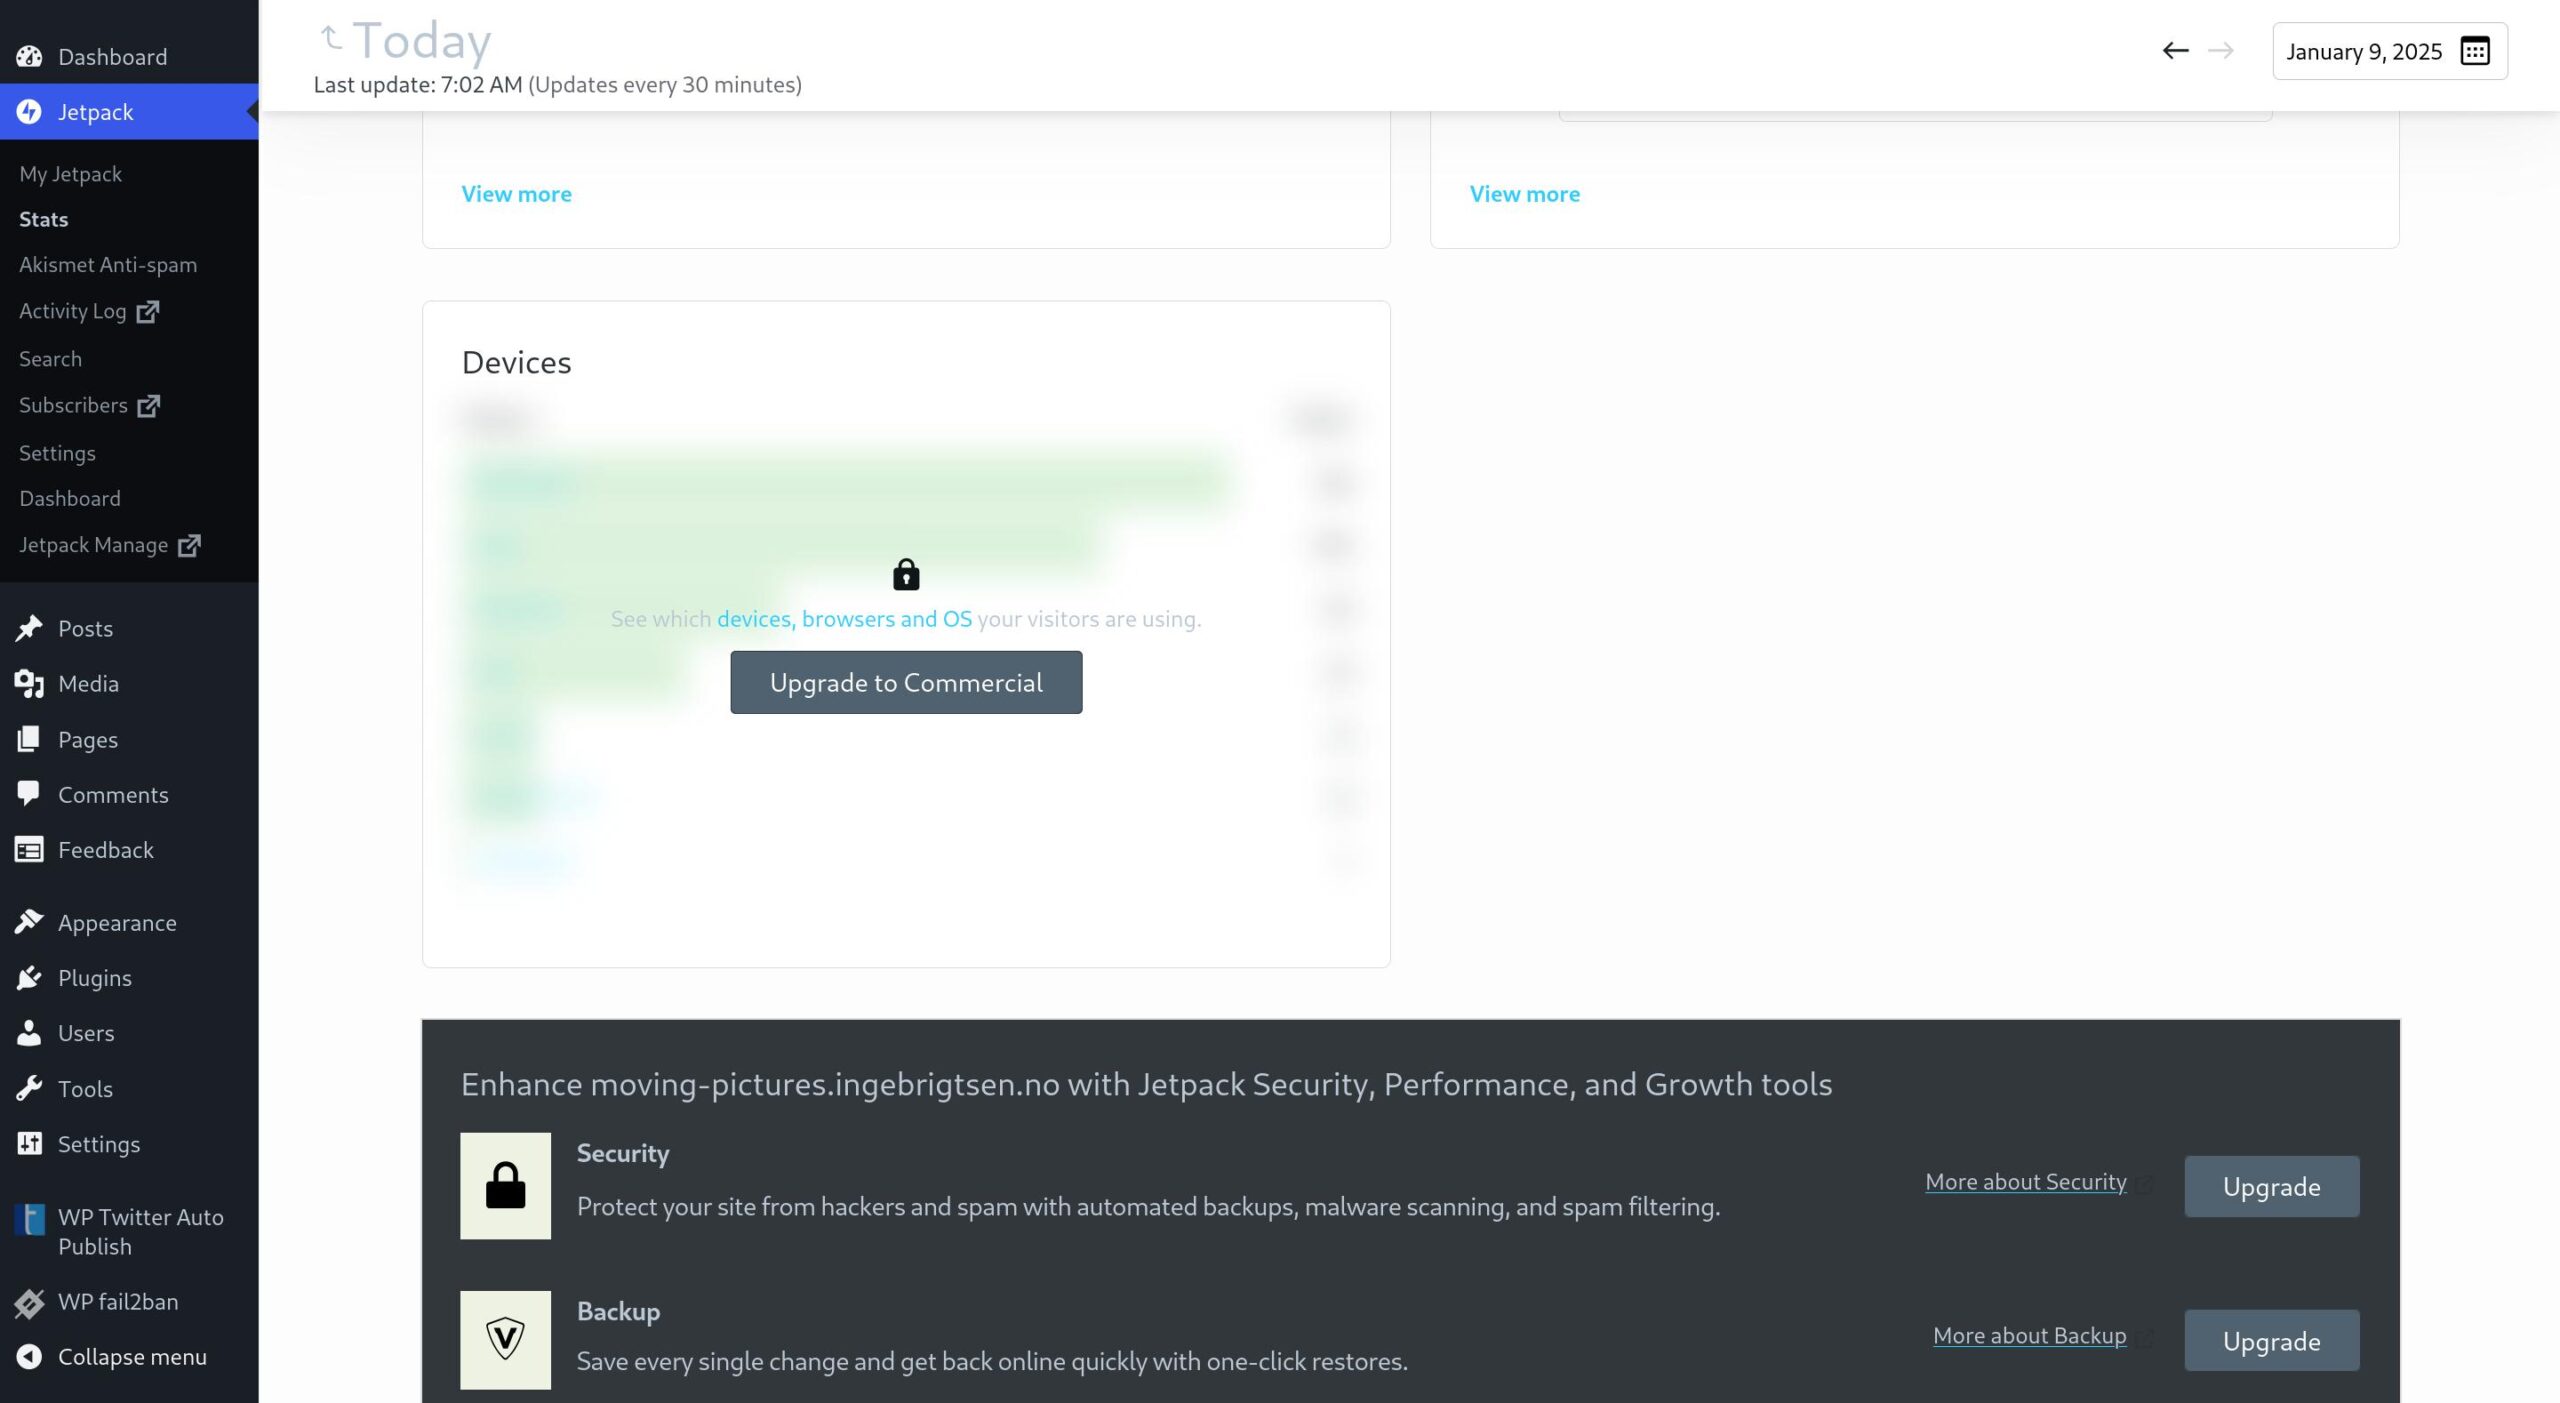
So scroll down more, and we get more upsells, and…
… finally some more upsells.
So that’s the new stats page: On this laptop, you have to scroll three screens to glean the “useful” information, and that’s obviously useless.
This page is mostly here to upsell, I guess? Stats is the primary reason people install Jetpack Stats, so it must be seen as the primary channel for upselling people more services from Automattic, so they put all the ads on the stats page? 🤷
But even if you’ve bought everything Automattic has to sell here, the page is still pretty useless, unless you enjoy scrolling (or has a very tall screen).
This sort of stuff pisses me off, so I’m finally doing what I should have done a decade ago: Write my own stats thing, and one that doesn’t involve looking a web page.
Here’s some design points:
- I want all the information available at a glance.
- I want “today’s” data to be on a 24 hour basis, so that I look at
how many visits I got over the last 24 hours, and not 2 hour’s worth of data if I’m looking at it at two in the morning. - I want to look at the data across all my blogs at the same time.
- I want it to update automatically without having to wait for a reload.
So, obviously, I have to write a plugin to stash the data. And no, one can’t just parse the Apache log, because there’s too much noise there. What Jetpack Stats does (an what almost all stats libraries do) is to trigger the data collection from Javascript, because this weeds out 99.9% of the bots. (Not 99.9% of the bot traffic, though — the major web spiders (like Googlebot) will request (some) JS-triggered requests, but these are mostly well-behaved and have User-Agent strings that are easy to filter out, and there’s only a couple dozen of these.)
So this plugin does the same: An async fetch after the page has been fully rendered, triggered from Javascript. (Yes, this loses hits from people who don’t use Javascript, but those people probably don’t want to be counted anyway.) (And an advantage of using self-hosted stats is that Adblock won’t block the stats. Probably. And no cookies!)
In addition, it’s fun to see what people click, so (like Jetpack Stats), I’m instrumenting all <a> links, so when people click on something, that’s registered, too.
And while I’m at it, I’m also instrumenting <video> elements, and also Lyte/Youtube embeds.
And that’s all the plugin does — it’s a few dozen lines of JS/PHP code. It’s really quite easy and nice working inside the WordPress framework…
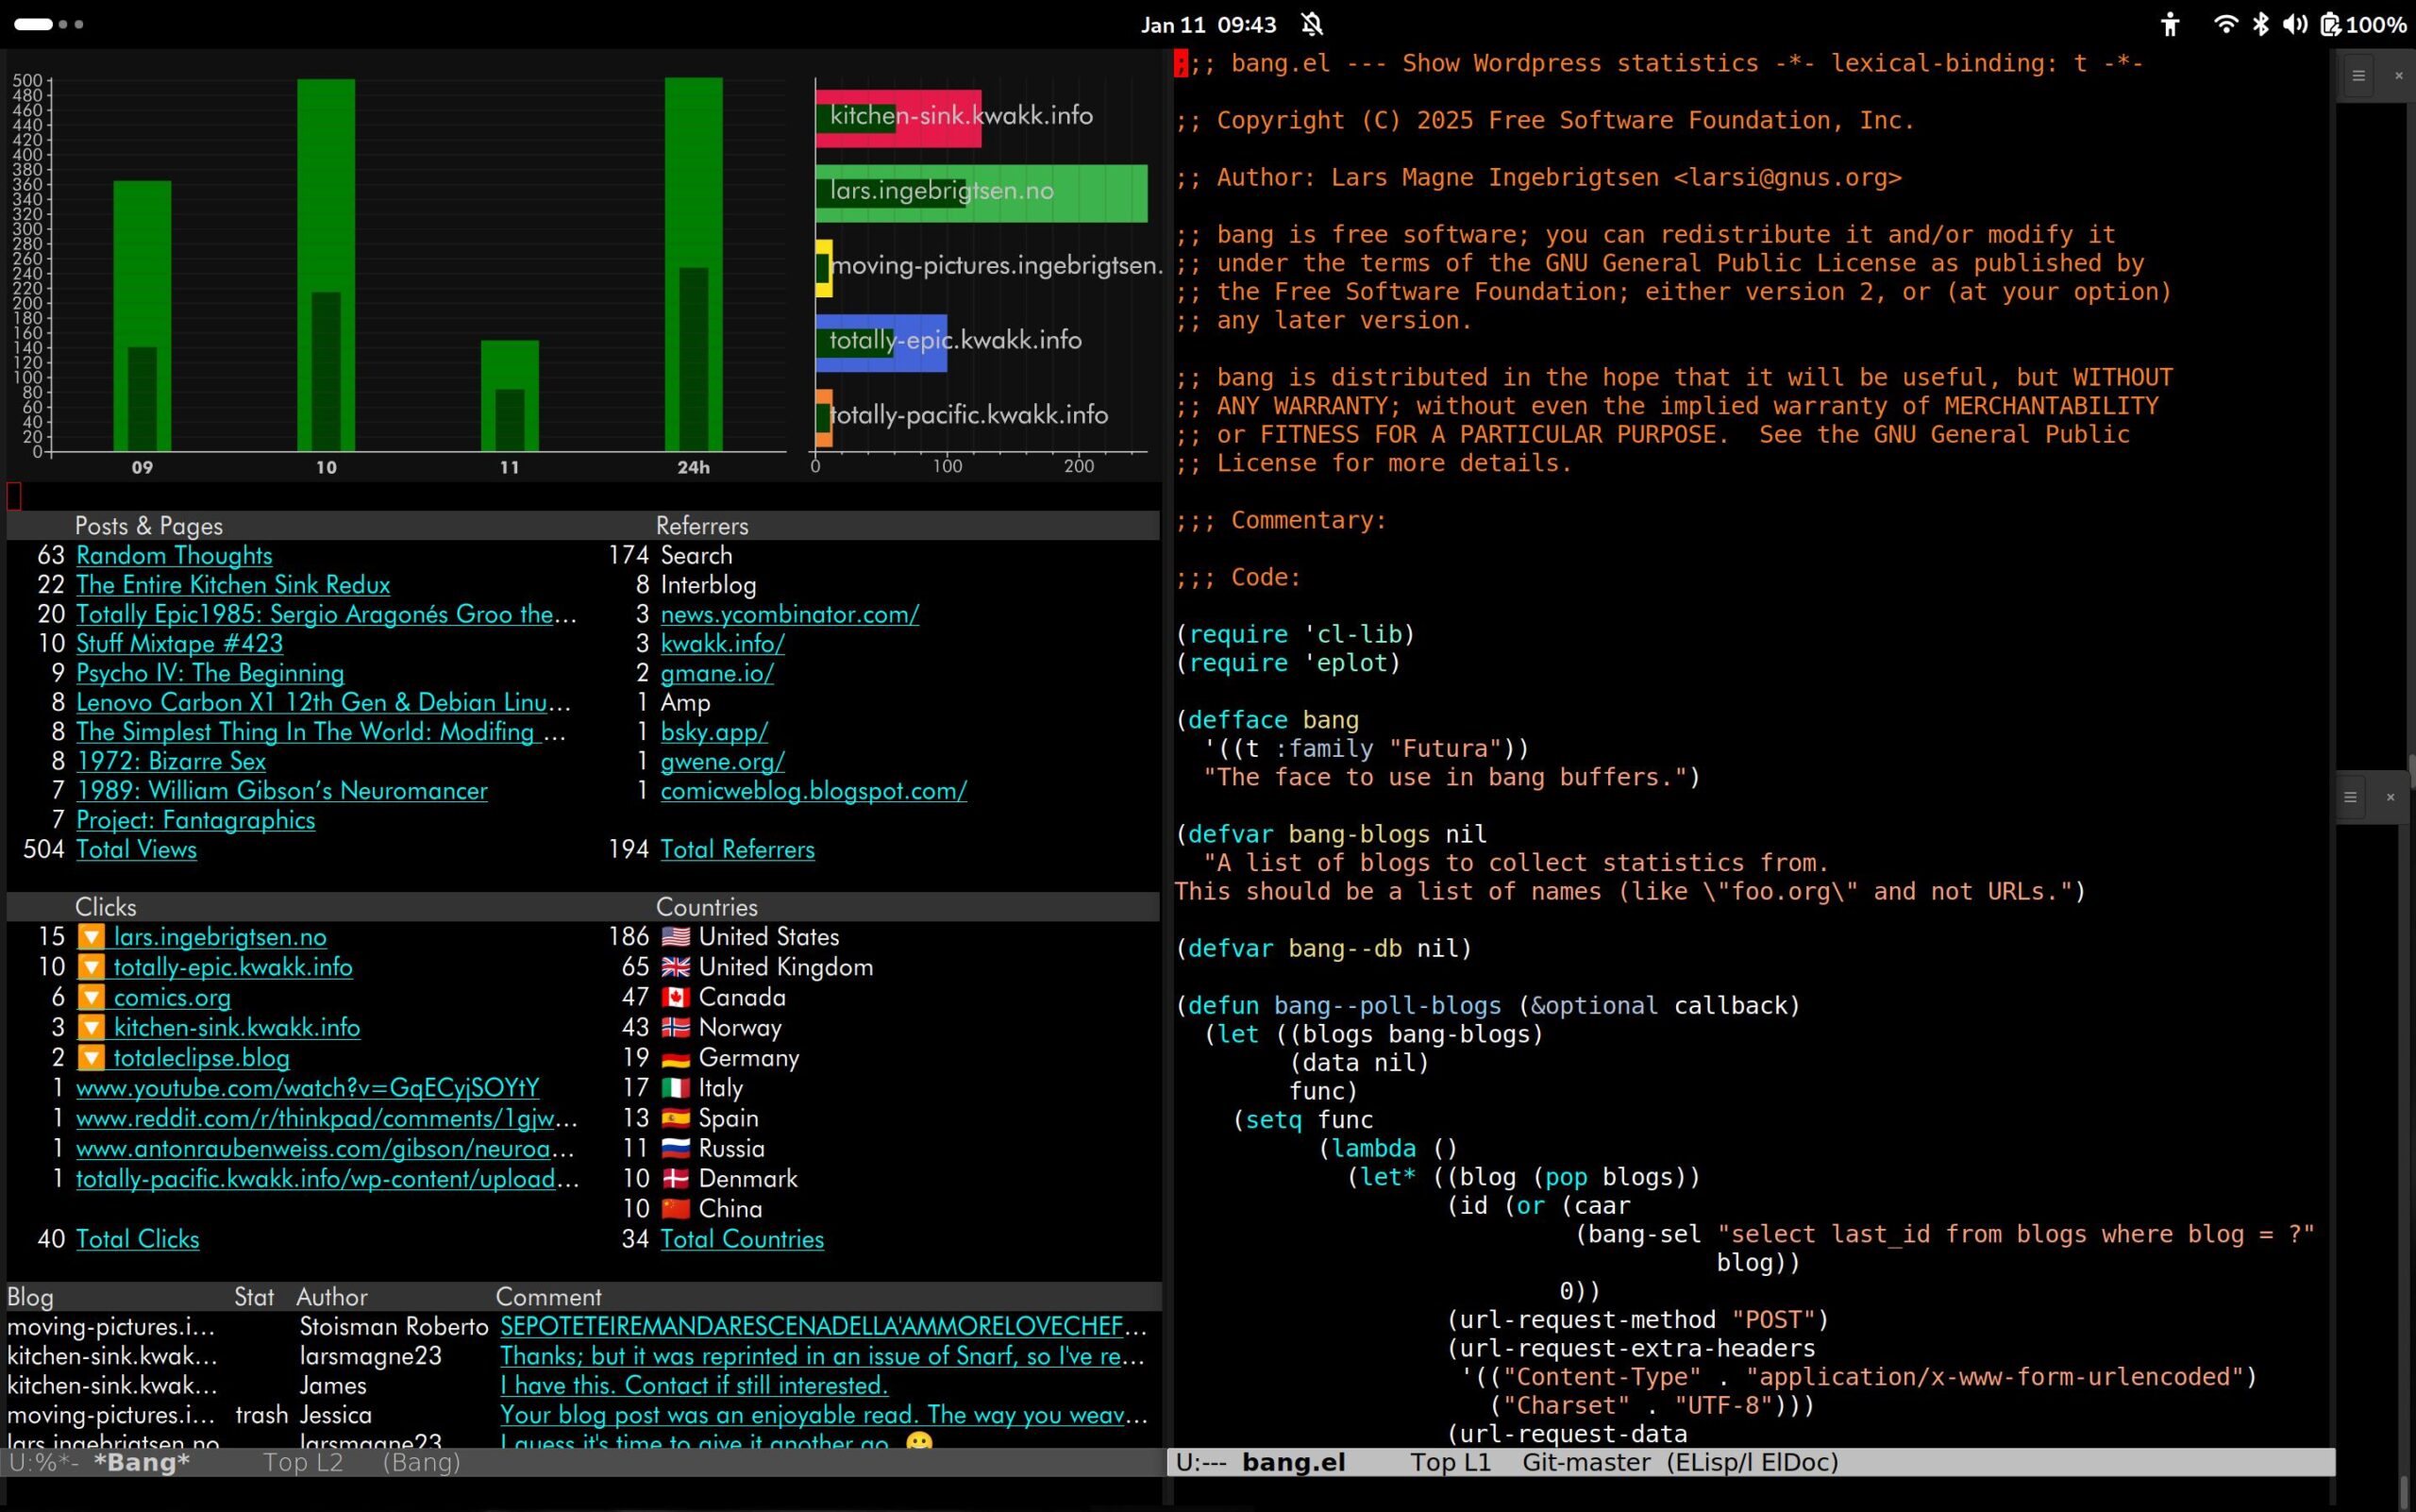
Then I just have an API that dumps out this collected data, and the rest happens… in Emacs, of course.
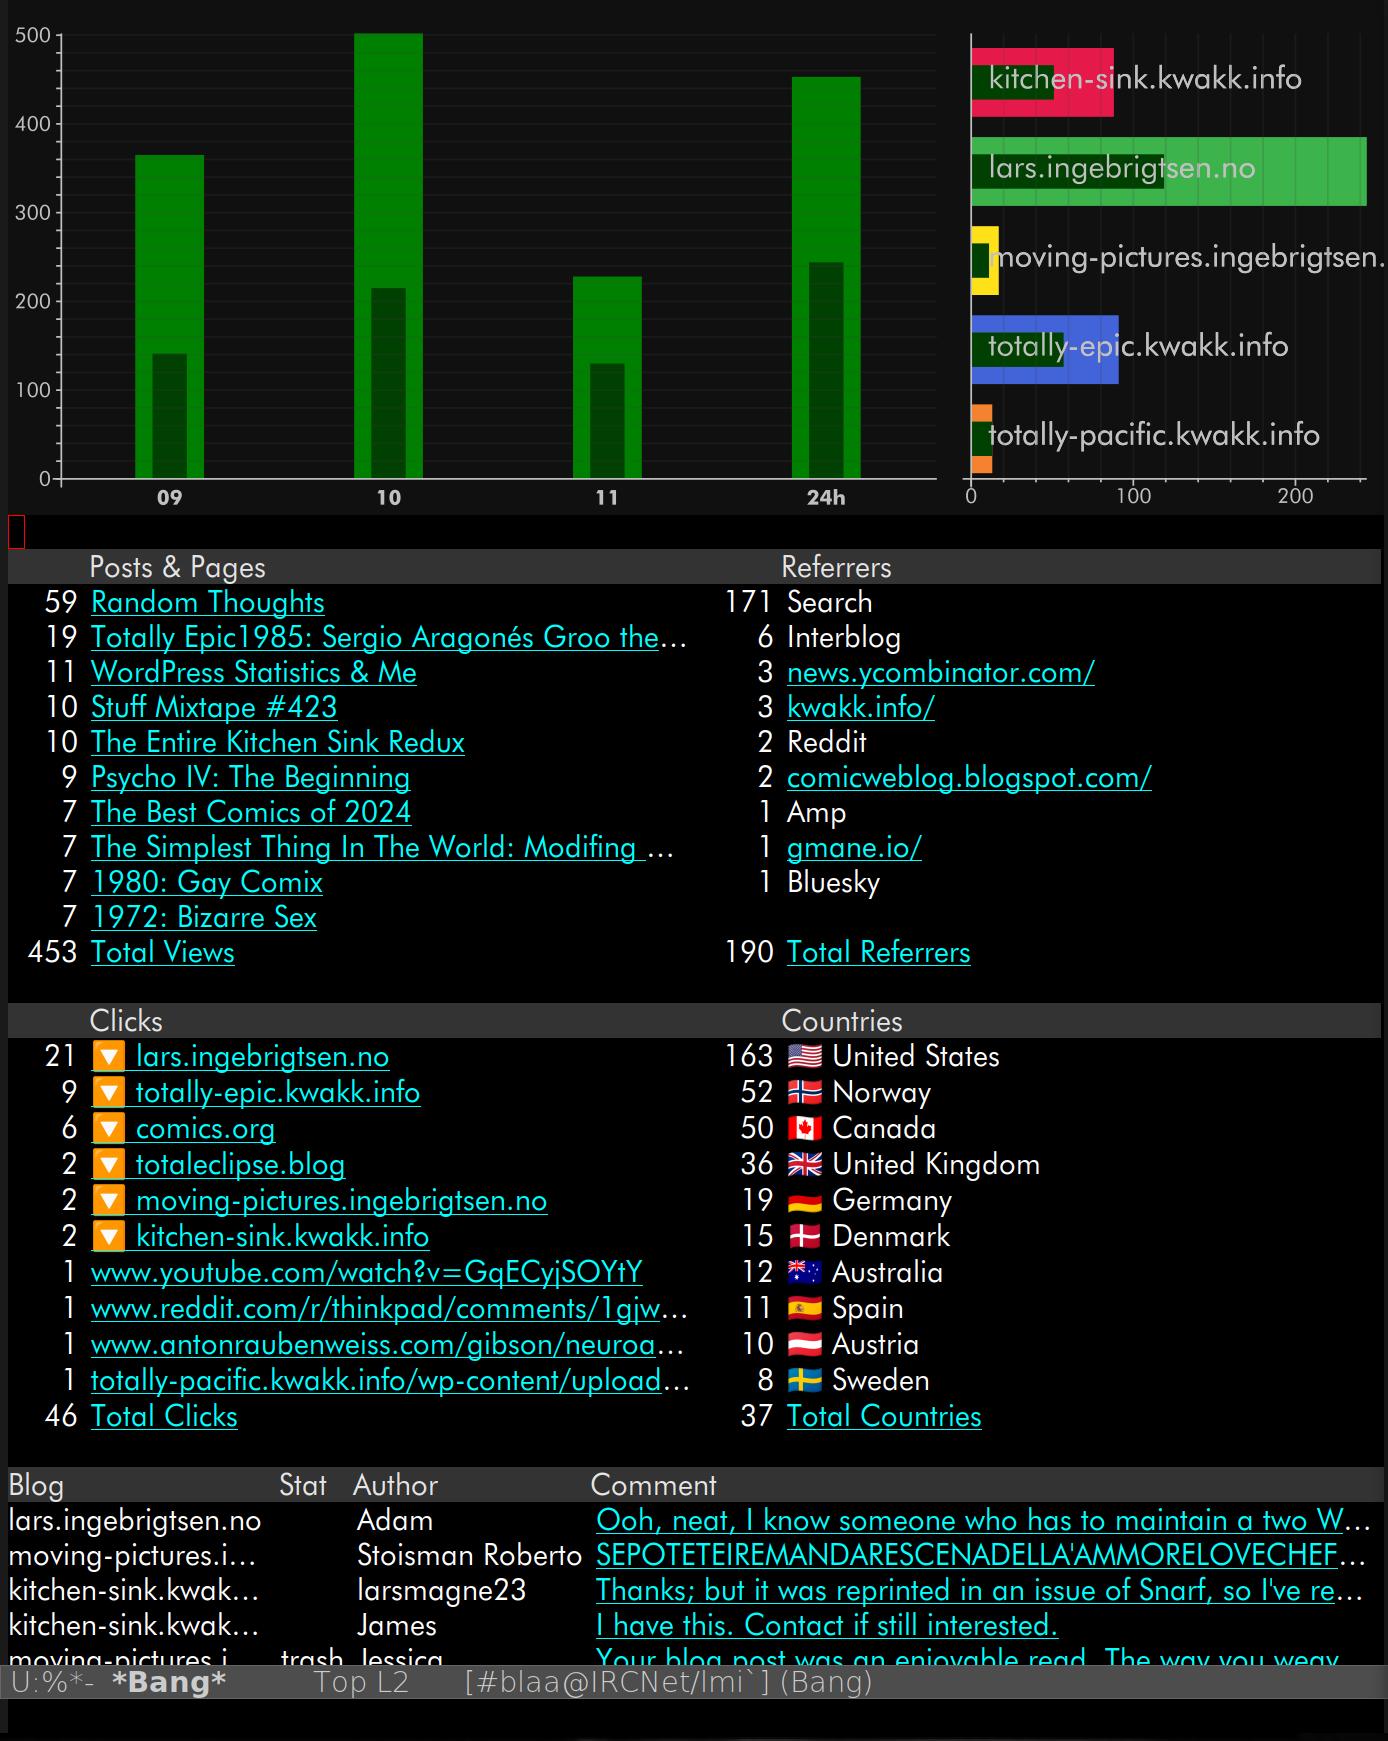
Tada! All the data available in one window, without any scrolling.
But after using the new interface for a couple days, I’m starting to wonder whether the reason they’re using the view-per-date as the most prominent indicator in interfaces like this not because of technical laziness but because of psychology. Let me bloviate:
When the date flips, you’ve confronted with the above: 100% down from the previous day! *gasp* So it’s negging you and making you disappointed. But every time afterwards you reload the page, the number goes up and everybody loves it when the number goes up, right? So doing it this way may be addicting people to the stats: First it gives you a negative shock, and then it rewards you for every reload. Dopamine, man! A 24 hour rolling view doesn’t give you any of that: The number will stay mostly the same, decreasing or increasing a bit each time, and that’s no fun now is it?
IT”S ALL A CONSPIRACY!
Anyway, this took me two days to do, and I ended up with a solution that is (for my use case) far superior to what WordPress has ever had. Your mileage will vary, of course — everybody’s got different preferences. But the reason most people install Jetpack is because of the stats functionality, so you’d think Automattic would be leery at annoying people too much. The layout changes (and attendant slow page load times) were what pushed me over the edge and make me implement my own solution.
When it’s this easy to implement something like this, Automattic is, in my opinion, shooting themselves in the foot by forcing people into changes they don’t want. I mean, absolutely nobody except me is going to use what I hacked together, but when it’s this easy, surely somebody else will write a plugin called Just The Stats And Nothing More or something?
(Yes, there are a lot of other plugins that say they’re good for stats, but from what I can tell by a cursory look-through, most of them seem to be aimed at scum. Sorry, I mean marketers, and many of them seem sleazy and filled with upsells and nobody wants that.)
I’ve got one blog hosted at WordPress.com, but this sort of stuff obviously won’t work there (they don’t allow people installing oddball plugins willy nilly, wisely enough), so I guess I’ll have to move it to self hosting, too. The only reason I haven’t done so before is that I thought it would be nice to continue to pay Automattic some money since they’re doing a lot of good work, but… (The recent meltdowns at Automattic don’t help here.)
Having all this information available in a local SQLite database means that I can add more commands that Jetpack Stats doesn’t have. For instance, there’s three Hacker News referrers? What’s that about, then?
It’s nice to have the data.
And, er, I couldn’t come up with a name when I started typing away, so it ended up being called “bang”, named after Gilbert Hernandez’s Bang & Inez. It’s on Microsoft Github, and I’m already regretting the name. Sorry!
[Edit: I renamed it to “wse”, as in “WordPress Statistics for Emacs”. I ended up with buffer names like “*Bang Date*” which was just too hilarious!]
While I’m bloviating away…
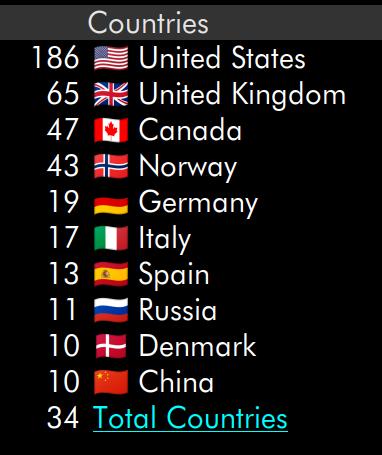
Those Unicode people are pretty smart. I guess everybody knows that those flags are composed by two Unicode characters, so the US flag is 🇺 and then 🇸 and when you put them next to each other, the rendering engine renders it as 🇺🇸 instead? That’s already really clever, but I’ve never looked into what code points like 🇺 are. That is, how they’re arranged, and whether you need some kind of table or something to make the mapping. But no!
You just add 0x1f1a5 to the ASCII code and Bob’s your sister’s brother, possibly.
… well, I thought it was neat. What! Ever!



Ooh, neat, I know someone who has to maintain a two WordPress driven sites – this looks compelling. Now she just has to learn Emacs.